Actually, as I was out of the market for last week on vacation, this is a great opportunity to look at the market and see where all the markets are.
First, the overall trend in the SPYs is one of consolidation. Prices have broken an uptrend (a), but are now consolidating in a triangle pattern (b).
Notice that prices are consolidating between lines (a) and (b). At (c), notice the 10 and 20 day EMA are moving more or less sideways, with the 10 still above the 20. This adds further credence to the argument that we're consolidating; if we were in the middle of a further downside move, at the very least the 10 day EMA would be moving lower at a far faster pace. Prices are also above the 50 day EMA (d).
The technical also tell us we're consolidating. Money is note flowing out of the market (a and b). Instead we're seeing a reversal of momentum (c) -- a standard sell-off after a big gain.
There are three areas of downside support: 118.00 (a): a round number and an area around which we've seen prices cluster. The 50 day EMA (b) and the 38.2% Fibonacci level (c): 115.78
Regarding the Treasury market, notice the long end (the TLTs) started lower first. They broke trendline (a) and are now is a clear downward sloping channel that is moving sharply lower (b).
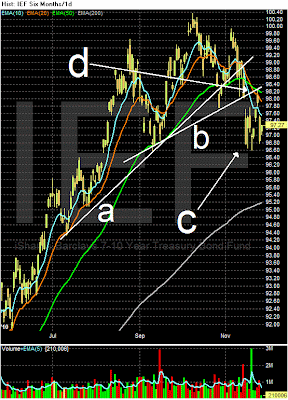
Now we see the IEFs (the 7-10 year Treasury market) following suit. Prices have broken two trend lines (a and b) and are now clustering in the area marked with (c). Also note the EMA picture (d): all the shorter EMAs are moving lower, with the shorter below the longer. This indicates the trends are clearly lower for now.
The dollar continues its rebound. Note the EMA structure (a): the shorter EMAs are rising and the 10 day EMA has crossed over the 50 day EMA. The 20 is about to do the same. There is upside resistance at the 23.34 Fib level (61.8% retracement) and the 200 day EMA.
logo
Popular Posts
-
I see that there is more trouble for the beleaguered Royal Mail, as over 25,000 postal workers strike this this weekend in an ongoing row ov...
-
- by New Deal democrat This is the third and last post in which I dissect the January jobs report. As you recall, there was a lot of head...
-
- by New Deal democrat Berkeley Prof. Brad Delong has sounded another clarion call for the discipline of economics to examine why the domin...
-
From Bonddad: Brodero has been commenting here for some time. I have always been impressed with his insights and asked him to post regularl...
-
- by New Deal democrat Some months ago another progressive blogger took a shot at us because some very un-progressive bloggers are on our ...
Category
- Alistair Darling (93)
- Barclays (69)
- Budget (48)
- EU (298)
- Gordon Brown (128)
- HSBC (30)
- IMF (59)
- Northern Rock (90)
- bailout (89)
- bank of england (201)
- bankruptcy (69)
- bonus (49)
- chancellor of the exchequer (46)
- credit cards (33)
- credit crunch (113)
- credit markets (8)
- credit squeeze (113)
- debt (285)
- debt celing (17)
- dollar (87)
- economic numbers (232)
- employment (66)
- finance (61)
- fraud (118)
- fsa (116)
- government (88)
- greece (315)
- greed (104)
- housing (248)
- inflation (156)
- interest rates (178)
- market analysis (859)
- mortgages (137)
- recession (452)
Blog Archive
-
►
2012
(987)
- August (55)
- July (121)
- June (124)
- May (134)
- April (116)
- March (136)
- February (152)
- January (149)
-
►
2011
(1264)
- December (102)
- November (103)
- October (113)
- September (114)
- August (118)
- July (110)
- June (104)
- May (102)
- April (98)
- March (113)
- February (96)
- January (91)
-
▼
2010
(1302)
- December (101)
- November (106)
- October (101)
- September (108)
- August (106)
- July (106)
- June (99)
- May (94)
- April (127)
- March (119)
- February (112)
- January (123)
-
►
2009
(987)
- December (123)
- November (119)
- October (131)
- September (120)
- August (114)
- July (121)
- June (131)
- May (50)
- April (19)
- March (23)
- February (18)
- January (18)
-
►
2008
(724)
- December (17)
- November (21)
- October (13)
- September (16)
- August (14)
- July (20)
- June (59)
- May (80)
- April (109)
- March (123)
- February (133)
- January (119)
Archive
Copyright © 2011 Loans And Finance | Powered by Blogger
Design by Free WordPress Themes | Bloggerized by Lasantha - Premium Blogger Themes | cheap international calls
0 nhận xét:
Post a Comment