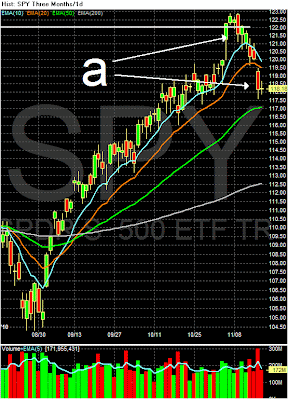
Price action yesterday was pretty straightforward: prices rose a bit in the early morning (a) then traded ins a very tight range for most of the day (b) before falling a bit at the end of trading (c).
On the daily chart, prices formed a very thin and narrow candle at the end of a sell-off (a). Narrow trading days at the end of a sell-off can be signs the selling is over.
The dollar continued higher (a), although prices today hugged the trend line very tightly (b).
Today, prices traded in a very tight range.
After consolidating in a tight range (A), lumber has rallied a bit. Notice there are two uptrends: a shorter one (B) which prices have already violated and a longer one (C) which is currently acting as support for prices. Also note the shorter EMAs are starting to move lower (D)
Soy beans also have several uptrends. The longer one (A) is still firmly intact, but the second one (B) has been broken (D). Also note the MACD has given a sell signal.
logo
Popular Posts
-
I see that there is more trouble for the beleaguered Royal Mail, as over 25,000 postal workers strike this this weekend in an ongoing row ov...
-
- by New Deal democrat This is the third and last post in which I dissect the January jobs report. As you recall, there was a lot of head...
-
- by New Deal democrat Berkeley Prof. Brad Delong has sounded another clarion call for the discipline of economics to examine why the domin...
-
From Bonddad: Brodero has been commenting here for some time. I have always been impressed with his insights and asked him to post regularl...
-
- by New Deal democrat Some months ago another progressive blogger took a shot at us because some very un-progressive bloggers are on our ...
Category
- Alistair Darling (93)
- Barclays (69)
- Budget (48)
- EU (298)
- Gordon Brown (128)
- HSBC (30)
- IMF (59)
- Northern Rock (90)
- bailout (89)
- bank of england (201)
- bankruptcy (69)
- bonus (49)
- chancellor of the exchequer (46)
- credit cards (33)
- credit crunch (113)
- credit markets (8)
- credit squeeze (113)
- debt (285)
- debt celing (17)
- dollar (87)
- economic numbers (232)
- employment (66)
- finance (61)
- fraud (118)
- fsa (116)
- government (88)
- greece (315)
- greed (104)
- housing (248)
- inflation (156)
- interest rates (178)
- market analysis (859)
- mortgages (137)
- recession (452)
Blog Archive
-
►
2012
(987)
- August (55)
- July (121)
- June (124)
- May (134)
- April (116)
- March (136)
- February (152)
- January (149)
-
►
2011
(1264)
- December (102)
- November (103)
- October (113)
- September (114)
- August (118)
- July (110)
- June (104)
- May (102)
- April (98)
- March (113)
- February (96)
- January (91)
-
▼
2010
(1302)
- December (101)
- November (106)
- October (101)
- September (108)
- August (106)
- July (106)
- June (99)
- May (94)
- April (127)
- March (119)
- February (112)
- January (123)
-
►
2009
(987)
- December (123)
- November (119)
- October (131)
- September (120)
- August (114)
- July (121)
- June (131)
- May (50)
- April (19)
- March (23)
- February (18)
- January (18)
-
►
2008
(724)
- December (17)
- November (21)
- October (13)
- September (16)
- August (14)
- July (20)
- June (59)
- May (80)
- April (109)
- March (123)
- February (133)
- January (119)
Archive
Copyright © 2011 Loans And Finance | Powered by Blogger
Design by Free WordPress Themes | Bloggerized by Lasantha - Premium Blogger Themes | cheap international calls
0 nhận xét:
Post a Comment