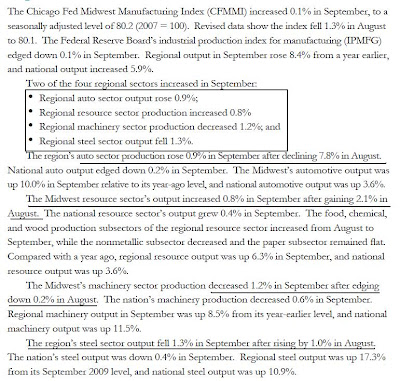
Manufacturing activity was one of the primary drivers of the latest expansion. It was one of the first economic areas to show a rebound. However, over the past few months it has since slowed a bit, although it is hardly crashing. I believe the best description of the growth in this sector is "moderating." Other indicators also suggested generally stronger activity. The index for capacity utilization moved up three points to 9, while the backlogs of orders contracted at a much slower pace, gaining nine points to −3. The delivery times index added one point to end at 6, and our gauges for inventories were somewhat higher in November. The finished goods inventory index increased ten points to 16, and the raw materials inventory index advanced five points to finish at 15. Overall, the Eastern seaboard looks to be in fair shape. This is important, as this geographical area was a problem area in the latest Beige Book. While this region is not out of the woods, it is in a clearly better position than a few months ago. The Chicago Fed was up slightly in its latest report, but has been printing a horizontal number for the last few months: Here is the relevant information from the latest report: The Kansas City Manufacturing index has printed three strong months: 
Overall industrial production has bounced back from its post recession lows. While the last four months have shown slower growth, note that periods similar to this were evidence in the previous expansion and are also evident from a longer view of the data (which goes back to 1910).
Capacity utilization cratered during the recession, printing its lowest level in almost 40 years. However, it too is bouncing back.
The ISM national manufacturing numbers have been consistently printing about 50 for over a year, indicating the manufacturing sector is doing well.
The ISM new orders index was approaching 50 -- the line that delineates between expansion and contraction -- but bounced back strongly in the latest report:"The manufacturing sector grew during October, with both new orders and production making significant gains. Since hitting a peak in April, the trend for manufacturing has been toward slower growth. However, this month's report signals a continuation of the recovery that began 15 months ago, and its strength raises expectations for growth in the balance of the quarter. Survey respondents note the recovery in autos, computers and exports as key drivers of this growth. Concerns about inventory growth are lessened by the improvement in new orders during October. With 14 of 18 industries reporting growth in October, manufacturing continues to outperform the other sectors of the economy."
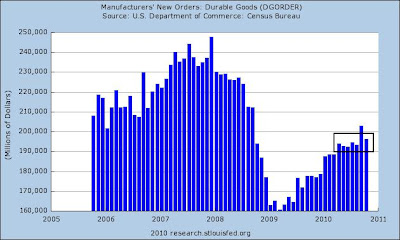
The durable goods new orders numbers have been near stagnant for the last 4-6 months:
However, this number is extremely volatile. As the chart below shows, long periods of near stagnation and volatility occur during expansions.
The NY Fed's latest numbers were horrible:The Empire State Manufacturing Survey indicates that conditions deteriorated in November for New York State manufacturers. For the first time since mid-2009, the general business conditions index fell below zero, declining 27 points to -11.1. The new orders index plummeted 37 points to -24.4, and the shipments index also fell below zero. The indexes for both prices paid and prices received declined, with the latter falling into negative territory. The index for number of employees remained above zero but was well below its October level, and the average workweek index dropped to -13.0. Future indexes generally climbed, suggesting that conditions were expected to improve in the months ahead, although the capital spending and technology spending indexes inched lower.
However, this report was balanced out by the Philly Fed's numbers:
The survey's broadest measure of manufacturing conditions, the diffusion index of current activity, increased from a reading of 1.0 in October to 22.5 in November (see Chart). This is the highest reading in the index since last December. Indexes for new orders and shipments also improved this month, and each index increased 15 points. Indexes for both delivery times and un-filled orders changed from negative to positive this month, suggesting improvement.
And the Richmond Fed also printed an improved number, although not as strong as the Philly Fed's numbers:
In November, the seasonally adjusted composite index of manufacturing activity — our broadest measure of manufacturing — rose four points to 9 from October's reading of 5. Among the index's components, shipments rose four points to 7, new orders edged up two points to finish at 10, and the jobs index increased six points to 10.
The net percentage of firms reporting month-over-month increases in production in November was 21, up from 10 in October and 14 in September (Tables 1 & 2, Chart). The increase in production occurred among both durable and nondurable goods producing plants, with a sharp rise in machinery, high-tech, printing, and transportation equipment activity partly due to higher export orders. All other month-over-month indicators also improved from the previous month. The shipments, new orders, and order backlog indexes climbed higher, and the employment index reached its highest level since late 2007. The new orders for exports index rose from 0 to 11, and both inventory indexes moved into positive territory.
Texas area factory activity has been bouncing near 0 for the better part of this year:
Texas factory activity increased in October, according to business executives responding to the Texas Manufacturing Outlook Survey. The production index, a key measure of state manufacturing conditions, was positive for the second consecutive month and slightly higher than its September reading.
Despite the rise in output, several other manufacturing activity indicators fell again. The new orders and shipments indexes were negative for the fifth consecutive month. The capacity utilization index dipped below zero, with more than one-quarter of respondents reporting a decrease.
Measures of general business conditions improved markedly in October, suggesting the broader economy strengthened. After four months in negative territory, the general business activity index rose sharply from –18 in September to 3 this month. The company outlook index also jumped up, rising from –4 to 13. The advance in the index was largely due to a sharp decline in the share of manufacturers reporting a worsened outlook, falling from 25 percent to 13 percent.
The above numbers show a sector that is slowing as demonstrated by the moderating pace of industrial production growth over the last new months. In addition, capacity utilization is still low and several regional federal reserve manufacturing numbers (New York, Richmond and Texas) show clear signs of slowing. While the durable goods numbers have been near stagnant for the last 4-6 months, this is typical of this particular data series. On the positive side, the ISM number's latest number showed a strong pick-up in the latest report, the overall number has been positive for over a year and the Philly and Kansas City Fed showed strong improvement. In addition, the Chicago Fed manufacturing index is still printing a positive number, although at a moderating pace.


0 nhận xét:
Post a Comment