logo

Monday, November 22, 2010

Money Rolling In

Hot on the heels of securing an EU/IMF bailout package (estimated at being around Euro 80BN), the Irish government has also been promised approximately £7BN in the form of bilateral aid from the UK.

George Osborne claims that this is because Ireland is our "closest economic neighbour".

Many are asking why the UK needs to put money into Ireland on top of the EU/IMF bailout.

Does this mean that the bailout from the EU/IMF is not going to be enough?

Be that as it may, once Ireland is "sorted" next comes Portugal and Spain.

Yesterday's Market


There are two important trend lines in the short term market: (a) -- which prices have clearly broken and (b), which prices have also broken.


Over the last approximately one week, notice that prices have printed mostly down days (a) with several gaps lower. While prices have broken the downtrend (b), they have done so on fairly weak volume (c).


On Friday, prices dropped at the open (a), found support at previous lows (b) but rallied from those lows and moved higher for the rest of the day (c). Also notice that prices printed some strong gains at the end of trading on increasing volume.

However, the daily chart still looks like prices are going to consolidate for the next bit of time.


The Treasury market has also had a big sell-off over the last 10 days. Notice the three strong bars lower and two gaps lower. This is indicative of investors dumping shares.


Also note that prices have broken support line (a)
.


The dollar -- which caught a safety bid from the EU situation -- broke its uptrend on Thursday. With the news that Ireland will accept a bailout, this trend should continue.


Friday, November 19, 2010

Weekend Weimar and Beagle

We'll be back on Monday


Weekly Indicators: le 2010 Beaujolais Nouveau est arrivee Edition

- by New Deal democrat

This week's big data had to be the very strong retail sales number on Monday, the 4th positive number in a row. Retail sales for the last 4 months have been growing at an annualized rate of 10%, which may be helping jobless claims, which dropped to their lowest 4 week average in over two years. Housing permits and starts declined, but were within their flat range for the last 20+ months. The good Philly Fed index balanced last week's poor Empire State index, but Induystrial Production and Capacity Utilization flatlined. Leading Indicators were up .5, and last month's number was also revised to a +.5.

Here is this week's high frequency data:

The price of a barrel of Oil fell to about $82 a barrel. But Gas at the pump rose to $2.89 a gallon. If gasoline goes over $3/gallon, I expect consumers will react, and not in a positive way. Gasoline usage declined compared with last year, 8.952 vs. 9.015. Gasoline stocks have plummeted right back into their normal range for this time of year. Over the longer term, gasoline usage has remained about 6% below its rate from the first half of the past decade.

Meanwhile the Mortgage Bankers' Association reported that its seasonally adjusted Purchase Index decreased 5.0% last week, taking back the gain of the prior week.Purchase applications have stabilized generally in the last few months at a level about 20% lower than 2009. Meanwhile, the Refinance Index decreased 18.5% from the previous week, reacting sharply to higher mortgage rates.

The ICSC reported same store sales for the week ending November 13 decreased =0.1% week over week, but for the ssecond week in a row increased 3.4% YoY, the best comparison in several months. Shoppertrak once again did not report for the week, but did report that sales have been up 3.2% for the last six weeks compared with the same period in 2009.

The BLS reported 437,000 new claims, the third week in the last four that claims have broken out under 440,000, resulting in t he lowest 4 week moving average in over 2 years.

Railfax for the second week in a row showed outright decline in the advance over last year's loads for all sectors. As I indicated last week, some of this may be due to retailers ordering and receiving holiday goods early, after last year some were left without merchandise due to shipping delays, but we will see.

The American Staffing Association failed to report this week. Obviously the temp they hired to prepare the report failed to show up.

This week M1 is all about Quantitative Easing. It increased 5.0% in the last week alone (!), and is up 5.5% month over month and 12.5% YoY, hence “real M1” is up 11.3%. M2 increased .2% last week, +0.4% month over month, and 3.1% YoY, so “real M2” is up 1.9%. Real M2 had been up about 2.2% in the last few weeks so this is a slight setback.

Weekly BAA commercial bond rates increased 0.15% last week to 5.95%. This compares with yields on 10 year bonds up +.07%. There is a small degree of stress in this comparative movement.

The Daily Treasury Statement showed $91.5 B in receipts vs. $85.8 B a year ago, a gain of about 6.5% for the first 12 days of November. For the last 20 days, receipts are up $132.7 B vs. $125.7 B a year ago, a gain of about 5.7%. Seasonality is beng felt in these November numbers, which also mark the first time that we are comparing YoY with an advance from the recession bottom in withholding.

The LEI, retail sales, and initial jobless claims all tell us that not only is the dreaded double-dip not making an appearance, but a re-energized recovery may show increasing job creation as well, as to which I offer you the following (hopefully) thought-provoking graph, showing initial jobless claims in blue, left scale, and private nonfarm payrolls, inverted, in red, right scale :


We'll see in a couple of weeks.

I will be enjoying some of this year's vintage this weekend, and I wish everybody else an enjoyable weekend as well..

Philly Fed Screams Higher


From Bloomberg:

Philly Fed data have been lagging regional and national data but not in November. The report's November index on general business conditions jumped from a zero-flat trend to a prodigious 22.5 to indicate very sharp month-to-month growth. New orders rose more than 15 points to 10.4. Shipments also rose more than 15 points, to 16.8. The region's manufacturers are showing commitment by adding to their workforces as the jobs index rose more than 10 points to 13.3.

Other readings confirm strength: unfilled orders rose while delivery times and inventory contraction slowed. Input prices show steep month-to-month pressure at an accelerating rate yet output prices, that is prices manufacturers receive for their finished goods, continue to contract though now only slightly.

This report points to accelerating strength for what is already solid growth for the national manufacturing sector. Interestingly, these results contrast with Monday's weak Empire State report from the New York Fed, a report that had been significantly stronger than Philly's. Month-to-month swings in regional data shouldn't cloud what is generally a positive outlook and continued leadership for the nation's manufacturing sector.


Here is a chart of the data:


That is one heck of a huge print. This report stands in stark contrast to the Empire state from earlier this week. Given how close these regions are, I'd average them out and call the month a wash for the NY and Philly areas.

A Closer Look At Inflation


This week, the BLS issued CPI and PPI. Let's take a look at these numbers in more detail.

Let's start by defining what we're looking at with PPI

A family of indexes that measure the average change over time in selling prices received by domestic producers of goods and services. PPIs measure price change from the perspective of the seller. This contrasts with other measures that measure price change from the purchaser's perspective, such as the Consumer Price Index (CPI). Sellers' and purchasers' prices may differ due to government subsidies, sales and excise taxes, and distribution costs.
In other words, what we're looking at is what people selling goods and services are getting for their goods and services.

Let's start by looking at overall PPI:
The Producer Price Index for Finished Goods increased 0.4 percent in October, seasonally adjusted, the U.S. Bureau of Labor Statistics reported today. This advance followed a 0.4-percent rise in both September and August. At the earlier stages of processing, prices received by manufacturers of intermediate goods moved up 1.2 percent in October, and the crude goods index increased 4.3 percent. On an unadjusted basis, prices for finished goods advanced 4.3 percent for the 12 months ended October 2010, their largest year-over-year gain since a 5.1 percent rise in May 2010.
Here is a chart of the overall index


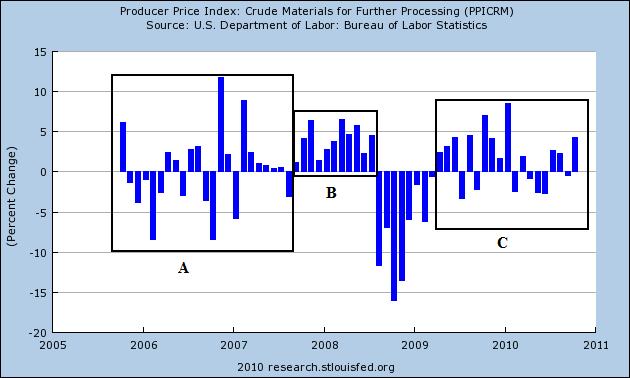
I've broken this down into three sections. (a) represents the month to month change in PPIs before the big commodity price spike in 2008. Section (b) represents the big spike and (c) shows where prices are now on a month to month basis. Notice that section (a) and (c) are fairly similar, but section (a) still has higher levels of month to month increases. So while we are seeing increases in producer prices, they aren't that large.


Above is a chart of the year over year percentage change in PPI. Notice it's more or less at levels that occurred in the last expansion.

Let's look at various stages of production.


I've also broken crude goods down into three sections like above. Notice that crude goods A and C sections are a bit more similar. Also note that we've seen bigger increases three of the last four months.


The (a) section of the intermediate goods chart is still more inflationary. However, notice that the last three months we've seen increasing PPI numbers.


PPI finished goods are still too low. Compare (b) with (a) -- (a) is still far higher.

In short, it looks as though crude and intermediate price increases are getting absorbed in the manufacturing process, leading to low finished goods readings. While the finished goods readings are still printing positive numbers, ideally we'd like to see these numbers a bit higher.

Let's turn to CPI:

The Consumer Price Index for All Urban Consumers (CPI-U) increased 0.2 percent in October on a seasonally adjusted basis, the U.S. Bureau of Labor Statistics reported today. Over the last 12 months, the all items index increased 1.2 percent before seasonal adjustment.

As has frequently been the case in recent months, an increase in the energy index was the major factor in the all items seasonally adjusted increase. The gasoline index rose for the fourth month in a row and accounted for almost 90 percent of the all items increase; the household energy index rose as well. The food index rose slightly in October with the food at home index unchanged.

The index for all items less food and energy was unchanged in October, the third month in a row with no change. The indexes for shelter and medical care rose, but these increases were offset by declines in an array of indexes including new vehicles, used cars and trucks, apparel, recreation, and tobacco.

Over the last 12 months, the index for all items less food and energyhas risen 0.6 percent, the smallest 12-month increase in the history of the index, which dates to 1957. The energy index has risen 5.9 percent over that span with the gasoline index up 9.5 percent. The food index has risen 1.4 percent, with both the food at home index and food away from home index rising the same 1.4 percent.


Let's look at the data, starting with core CPI


The month over month percentage change in CPI is clearly moving lower. Also note how rare a decrease is -- we've seen four prints in the last five years.


The pace of change from year ago levels is clearly moving lower and is now in dangerous territory. This chart is very dangerous for the economy as a whole.


The index for all items is clearly printing at lower rates than the month to month pace before the expansion (compare sections a and b).


The year over year percentage change in overall CPI is also moving lower.

These charts indicate that prices are still a concern and need to be addressed quickly.

The Bailout That Dare Not Speak Its Name

Ireland has finally bitten the bullet wrt the asking for a bailout from the IMF/EU. Negotiations over the terms of that bailout started today.

Key to those negotiations will be the 12.5% rate of corporation tax that has been the heart heart of Ireland's growing economy.

Whilst it will come under immense pressure from the EU to raise that rate (as the EU believes that it distorts the market), Ireland should bear in mind that the EU is desperate to shore up the Euro. The longer the uncertainty over the Irish economy continues, the greater the damage done the Euro.

All Ireland has to do is refuse to accept any bailout that ties a rise in corporation tax into the terms and conditons of the bailout. The EU is on the back foot here, like it or not it cannot afford to allow the Irish economy to go under.

The Irish people should not fret so much as their media is doing, Ireland is in a far better negotiating position than Greece was.

Thursday, November 18, 2010

Yesterday's Market


The dollar broke trend yesterday (c), breaking a strong uptrend that has been in place for the last ten days. While the uptrend is over, it's important to remember why this rally happened: the dollar is still seen as a safe haven currency.


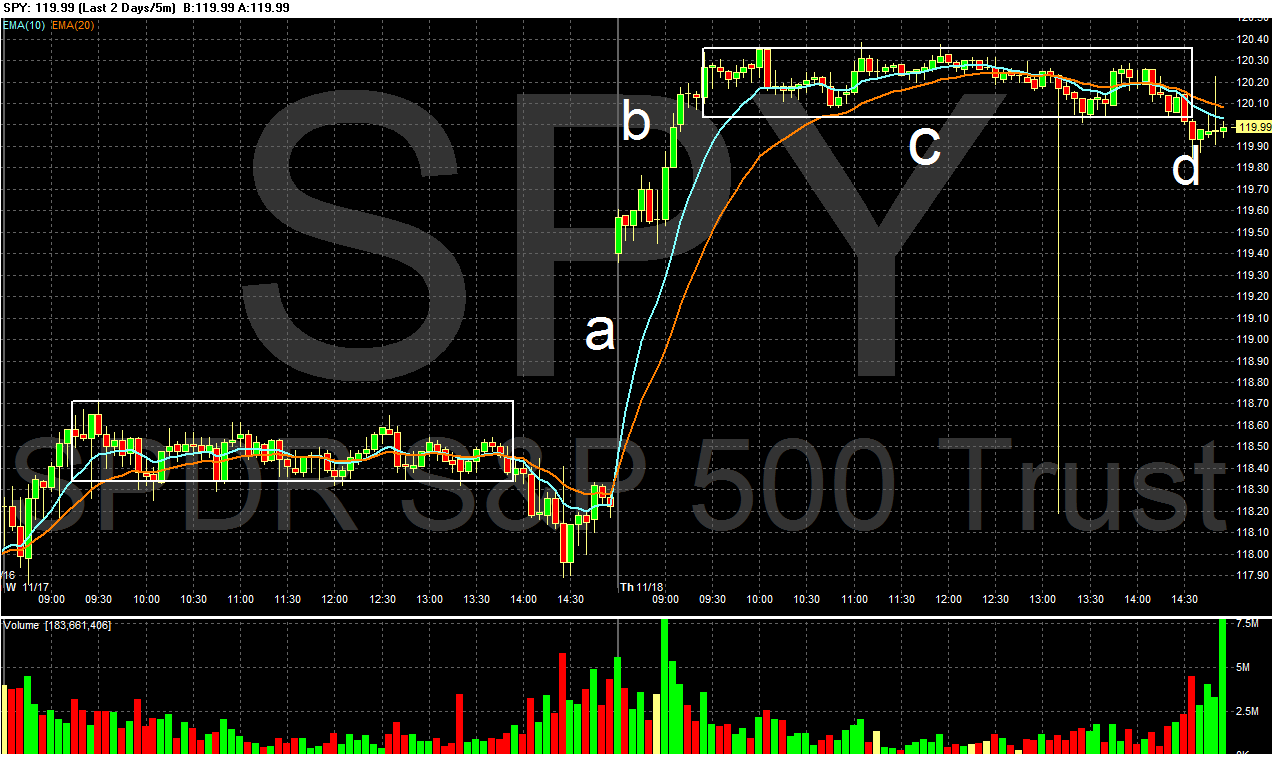
The equity markets gapped higher at the open (a), rallied in the early part of trading (b), then consolidated their gains for most of the day (c). Prices moved a bit lower at the end of trading (d), but not enough to really threaten the rally's gains.


I wouldn't be surprised to see equity prices consolidated between lines (a )and (b) on the top and (c) on the bottom.


The Treasury market has broken trend (a). Also note the EMA picture is becoming more and more bearish -- the 10 and 20 day EMAs have moved through the 50 and all are moving lower.


There are two ways to look at the chart for cattle. The first is as a triangle consolidation (A and B). The second is as a sideways consolidation between roughly 97 and 102. I would prefer the latter, largely because it has been going on for longer and it more closely resembles the EMA picture. However, it would be possible that both are correct; it simply depends on your time frame.


Gold finally broke the long-term trend line (a) at point (b). Also note the MACD is printing a sell signal right now (c).

LEIs Increase .5%


From the Conference Board:

Says Ataman Ozyildirim, economist at The Conference Board: “The LEI remains on an upward trend, suggesting the modest economic expansion will continue in the near term. The LEI’s growth has been slowing this year, but gains in the financial components helped its pickup in October.”

Says Ken Goldstein, economist at The Conference Board: “The economy is slow, but latest data on the U.S. LEI suggest that change may be around the corner. Expect modest holiday sales, driven by steep discounting. But following a post-holiday lull, the indicators are suggesting a mild pickup this spring.”

Let's take a look at the data:

The LEIs are continuing to increase, and are doing so at a steeper rate.


Only two of ten components decreased; all others (obviously) increased.


"Holy Grail" update

- by New Deal democrat

Over a year ago I identified real (inflation-adjusted) retail sales as the "Holy Grail," i.e., best single leading indicator for job growth. With Monday's retail sales and yesterday's inflation reports, we can update the graph comparing real retail sales and jobs.

First, here are the absolute numbers (note in this first graph I am using private jobs rather than full payrolls to take out the census distortions):


As of October, real retail sales have made up more than half of their losses during the Great Recession.

Here are the year over year percentage comparisons:


In 4 of the last 7 months, real retail sales have been up over 6%. Based on 65 years' worth of data, this translates into, at minimum, 2% (or about 2.5 million jobs) year over year job growth, sometime soon. Whether "soon" is more like 6 months or 24 months is impossible to tell, but the trend is unequivocally positive.

Share

Twitter Delicious Facebook Digg Stumbleupon Favorites More