logo

Thursday, August 26, 2010

Durable Goods Rise .3%

From the WSJ:

Orders for durable goods, products such as autos and appliances designed to last three years or more, rose 0.3% in July from June, largely due to aircraft orders, the Commerce Department said Wednesday. Excluding the volatile transportation sector, orders tumbled 3.8%.

The figures provided the latest evidence that the rebound in manufacturing, which propelled the early stages of the economic recovery, is unlikely to remain strong enough to offset weakness in consumer spending and waning support from federal stimulus.

A key gauge of future business investment—orders for nondefense capital goods excluding aircraft—fell 8% from a month earlier. That drop, the worst decline since January 2009, offset the gains seen in May and June.

While the durable-goods data can be volatile, they raised doubts about whether the underlying strength of businesses can keep the economy expanding in the second half of the year.

"The recovery has been relying so heavily on the industrial side of the economy for support, and it seems as though that support has now all but disappeared," said Ellen Beeson Zentner, an economist at Bank of Tokyo-Mitsubishi UFJ.

We've been seeing this slowdown in the latest regional manufacturing numbers.

From the NY Fed:

The Empire State Manufacturing Survey indicates that conditions improved modestly in August for New York manufacturers. The general business conditions index rose 2 points from its July level, to 7.1. The new orders and shipments indexes both dipped below zero for the first time in more than a year, indicating that orders and shipments declined on balance; the unfilled orders index was also negative. The indexes for both prices paid and prices received inched down, while employment indexes were positive and higher than last month. The six-month outlook weakened; though future indexes were generally still positive, many fell in August, with the notable exceptions of the future employment and capital expenditures indexes, which climbed after falling last month.


And here is the chart from the Philly Fed:


Notice it dropped below 0.

And here is the PMI.


While still positive, it has moved lower the last few months as well.

Here are the relevant durable goods charts:


Although still in an uptrend, durable goods orders have moved near sideways for the last few months.


And the ex-aircraft number dropped in a big way last month.

For more on manufacturing, see this interview in the WSJ.

An updated look at the Stressors on the Recovery

- by New Deal democrat

In the last couple of weeks, I have updated my "Big Picture" look at the economy. In the long term, the Slow Motion Bust is continuing, and will continue until the huge excesses of debt are wrung out of the system and prices (of housing) are reset to levels that ordinary people can afford. In the short term, the KISS method of relying on the LEI shows an economy converging on zero -- GDP is likely to be somewhere near zero this quarter and next.

In this post I want to take a look at the current status of the reasons why the economy is "converging on zero." I have listed them before, they aren't a surprise. Some, most notably the BP oil catastrophe, have already worked themselves out (although their afteraffects will certainly linger). Several important others are due to the expiration of government assistance, in one leading sector of the economy (housing), and one lagging sector (government employment). The price of Oil is also important. Let's take a look at them:

1. The Euro Crisis

The Eurozone crisis was the trigger that provoked the current downturn. Measures of fear in the markets shot up from March through May as the crisis intensified (although, it is important to note, never anywhere near 2008 levels). This fear was measured through LIBOR rates. Here is a current look at the 3 month LIBOR:


It has returned by more than 75% to its pre-crisis levels. This doesn't mean that there can't be a new crisis (is Greece solvent?), but for now, that stressor has generally dissipated.

2. The Price of Oil

In April with the price of Oil briefly topping $90 on an intraday basis, both Bonddad and I noted that high-priced Oil would be one certain way to derail the recovery in a hurry. Prof. James Hamilton, who is an expert in the area, noted that Oil briefly approached (or touched) the 4% of GDP (or 6% of discretionary income) that in the past had triggered recessions. Since that time, Oil has retreated, most recently to $70 again, but has been very volatile.

Here is a graph that looks at the monthly price of Oil measured as a divergeance from $90/barrel over the last 5 years, and compares it with quarterly GDP. As you can see, the price of Oil so measured has an excellent track record for predicting GDP in the immediate future.

The graph isn't perfect, because I should measure the "real" inflation adjusted price of Oil, which would make the inflection point closer to $85 five years ago. Also, as Prof. Hamilton points out, the velocity of the price change is also important. The economy might be able to handle a smaller change of e.g., $5/barrel per quarter, but it takes longer to "digest" larger changes, both up and down.

Nevertheless, just as we and others have said, the price of Oil is indeed having an impact on the economy, and all things being equal, predicts zero GDP -- a complete stall, but not a significant downturn -- in the next quarter or two, after which there may be a mild rebound.

3. The expiration of the $8000 housing creditt

As I pointed out yesterday, the post-expiration collapse has taken place. I do not expect further significant deterioration. Here are housing permits and starts going back 5 years to the top of the bubble:

And here are new home sales updated through yesterday:

We may bounce along the bottom for awhile, but this is a case where reporting percentage declines (35% lower than last year!!!) masks that the absolute decline is much, much smaller than it was earlier in the housing bust. Housing leads the economy, and this will have a negative effect that will feed through for some months to come -- but it is going to be a much smaller negative effect than in the 2006-2008 period.

4. Census, state and local layoffs

Through the week ending August 14, about 500,000 census workers have been laid off. Only 80,000 remain. Depending on their local state laws, some unknown amount of them will be eligible for unemployment benefits. Due to the insane Congressional inaction/ lame action on renewing stimulus to the states (some of which has reportedly been hoarded for next year rather than being used for its intended purpose), it is quite likely that there are thousands of government employees, most notably teachers, who have been laid off this month.

While those layoffs suggest a headlong rush back into deep recession, they are totally contradicted by what is happening in the private sector. Here is a graph of the American Staffing Association's temporary help index, which has continued to rise through last week, to a level equal to August 2008:

Now here is a graph comparing government employment (blue) with private employment (red):

As you can see, private employment has continued to rise all through this year. It is government employment (not just census, but also state and local governments) which have given us our dismal job reports in the last couple of months.

In summary, Oil supports the notion of a stall in the recovery, exacerbated by layoffs sparked by the decline of 100,000 houses a year not being built, and further exacerbated by state and local government layoffs sparked by the loss or hoarding of federal aid. Essentially, both of these sectors have been "reset" to one year ago by the loss of stimulus. I fully expect the state and local losses to abate once current budgets are in place, while the construction losses, while small, as a leading sector will echo through the economy for some months to come.

Additionally, while the slow motion bust will continue, and while the renewed slowdown will mean more pain, I see nothing in the data causing me to change my opinion that the "Great Recession" bottomed out in the summer of 2009.

Yesterday's Market


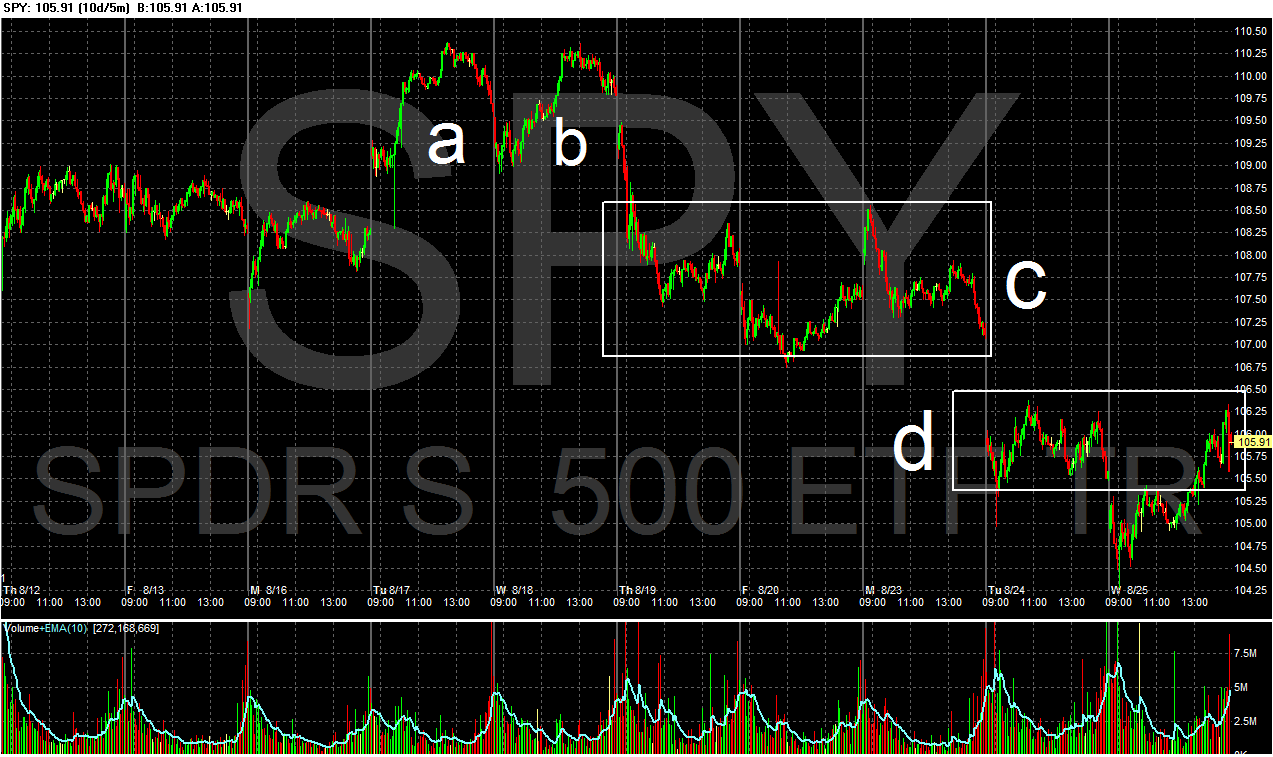
After forming a double top (a and b), prices have moved lower, consolidating in two general areas (c and d).


Yesterday prices gapped lower at the open (a) and moved lower. However, their lower points (b) were accompanied by a reverse in momentum (c), signaling a reverse. Prices then rose into the 50 minute EMA (d). They then reversed again (e) and rose for the rest of the day (f), moving through the resistance areas established at the close of the previous days markets (g). Notice how along the way, prices fell into the EMAs (h).

The Russell 2000 hit support at previous levels (b) and rallied strongly yesterday (a). This is probably the result of program trading.


The QQQQs have had three big gaps lower over the last two weeks (a, b and c).


After gapping higher yesterday (a), the IEFs moved lower for the remainder of the trading session (b and c). Prices traded higher into the 10 and 20 minute EMA throughout the day (d).

Yesterday's bounce looks technical. The IWMs hit support where there were probably a ton of computerized buy orders. The Treasury markets fall also looks like like a "let's take some profits off the table" situation.


Gold is still in a rally (a) and has consolidated gains by falling into the 10 and 20 day EMA (b). Also note the EMAs are in a very bullish posture (c) -- the shorter are above the longer and all are rising.


Wheat continues to correct after breaking its drought induced uptrend (a). Prices are currently at important support levels (b). If they fall through the next area of support is at the 50 day EMA (d). Also note that momentum is clearly negative (c).

Wednesday, August 25, 2010

Notes on the Bond Market

From the NY Times:

For a few months at the start of this year, things were looking up for stock market investing. Optimistic about growth, investors were again putting their money into stocks. In March and April, when the stock market rose 8 percent, $8.1 billion flowed into domestic stock mutual funds.

But then came a grim reassessment of America’s economic prospects as unemployment remained stubbornly high and private sector job growth refused to take off.

Investors’ nerves were also frayed by the “flash crash” on May 6, when the Dow Jones industrial index fell 600 points in a matter of minutes. The authorities still do not know why.

Investors pulled $19.1 billion from domestic equity funds in May, the largest outflow since the height of the financial crisis in October 2008.

Over all, investors pulled $151.4 billion out of stock market mutual funds in 2008. But at that time the market was tanking in shocking fashion. The surprise this time around is that Americans are withdrawing money even when share prices are rallying.

The stock market rose 7 percent last month as corporate profits began rebounding, but even that increase was not enough to tempt ordinary investors. Instead, they withdrew $14.67 billion from domestic stock market mutual funds in July, according to the investment institute’s estimates, the third straight month of withdrawals.

A big beneficiary has been bond funds, which offer regular fixed interest payments.

As investors pulled billions out of stocks, they plowed $185.31 billion into bond mutual funds in the first seven months of this year, and total bond fund investments for the year are on track to approach the record set in 2009.

Here is the accompanying graphic:


From last week's Barron's:

But in the Information Age, you can find out anything about anything on—where else?—Google. Google Trends tracks what people are searching as well as how many news stories mention the search term. And, observers Nicholas Colas, chief market strategist at BNY ConvergEx Group, "bubble" seems to have a hold on the imaginations of Google users for the better part of the past 18 months.

Colas notes that it takes a while for a bubble to inflate fully and burst. The peak in Google searches for "housing bubble" was in 2005—years before the top in the market. It takes time, and usually leverage, to get the last, credulous buyers who ignore all the warnings to buy at the top tick.

But as for the terms "bond bubble" and "Treasury bubble," Google hasn't had enough searches to register a trend, Colas finds. That suggests bond investors "seem oblivious to bubble chatter," so he concludes that any backup in yields is apt to be met with more buying.

.....

As ISI Group points out in its Friday missive to clients, yields on government bonds have collapsed around the globe in the past two months. While the 10-year U.S. Treasury yield hit a 16-month low of 2.53%, the German 10-year bund fell to a record low 2.27% while the comparable U.K. gilt dipped below 3%, to 2.98%. And in Japan, the 10-year yield is under 1%, at 0.94%. So it's not just an American phenomenon.

.....

More importantly, Gluskin Sheff's David Rosenberg—who's been spot-on in his call on bonds and the economy slowing to stall speed—also takes issue with the two Jeremies' assertion that the $559 billion influx into bond mutual funds and $233 billion exodus from equity funds from January 2008 to June 2010 signals a bubble. If anything, it shows households' increased acumen, says Rosenberg, given that Treasury bonds returned 13% over that span while stocks lost 21%.


From the WSJ:

A similar bubble is expanding today that may have far more serious consequences for investors. It is in bonds, particularly U.S. Treasury bonds. Investors, disenchanted with the stock market, have been pouring money into bond funds, and Treasury bonds have been among their favorites. The Investment Company Institute reports that from January 2008 through June 2010, outflows from equity funds totaled $232 billion while bond funds have seen a massive $559 billion of inflows.

We believe what is happening today is the flip side of what happened in 2000. Just as investors were too enthusiastic then about the growth prospects in the economy, many investors today are far too pessimistic.

.....

Today the purveyors of pessimism speak of the fierce headwinds against any economic recovery, particularly the slow deleveraging of the household sector. But the leveraging data they use is the face value of the debt, particularly the mortgage debt, while the market has already devalued much of that debt to pennies on the dollar.

This suggests that if the household sector owes what the market believes that debt is worth, then effective debt ratios are much lower. On the other hand, if households do repay most of that debt, then the financial sector will be able to write-up hundreds of billions of dollars in loans and mortgages that were marked down, resulting in extraordinary returns. In either scenario, we believe U.S. economic growth is likely to accelerate.


A few points/observations:

1.) Personally, from an investing perspective I'm a big fan of high quality, dividend paying equities and some fixed income. For example, I like portfolios that have companies like Exxon, MMM, coke, etc... The reason is with a dividend you always have a little bit of cash coming in. This puts a natural floor under the stock and provides an income stream for further investments. I'm hoping this style of investing is catching on; the pure growth play is a huge, double down bet at the investment table.

2.) As both NDD and I have pointed out, we've seen in increase in the personal savings rate over the last year or so. That money has to go somewhere. Savers see bank accounts paying next to nothing, so a bond mutual fund with liberal withdrawal privileges is the next best thing.

3.) In addition to the Treasury market, consider these charts of the mortgage backed bond market, investment grade corporate bond market and the junk bond market:


Money is clearly flowing into a variety of fixed-income funds, not just the Treasury Market.

4.) All of the fixed income markets have an inflection point that starts a rally right around the break-out of the Greek crisis this spring. This tells us that the Greek crisis was probably a catalyst event for the investment public, and a clear signal to put on the breaks and move money into more conservative venues. Since then, the US economy has printed weaker numbers, which has confirmed that asset shift to income yielding investments.


A note about Housing Permits, Starts, Sales, and Prices

- by New Deal democrat

Here's what Calculated Risk said about June existing home sales when they were reported a month ago:
Months of supply increased to 8.9 months in June from 8.3 months in May. A normal market has under 6 months of supply, so this is already high - and probably excludes some substantial shadow inventory. And the months of supply will increase sharply next month when sales collapse.
So July existing home sales were reported yesterday and, surprise surprise, they collapsed. This didn't prevent the usual Circle Jerks of Doom from taking place at the usual locations.

Notice I didn't use the present progressive tense, "collapsing". That's because home sales aren't.

In the first place, you have to distinguish between volume, i.e., the number of housing units being sold, from the prices at which they are being sold. As I pointed out just a couple of days ago, housing prices are nowhere near bottom and probably have at least two more years to fall. Here's a graph from Ned Davis Research via The Big Picture, making that same point:


But sales, i.e., volume, are another story altogether. Here's a graph, showing house permits (blue) and starts (red) since the peak of the housing bubble five years ago:


Note that both these series bottomed out in early 2009 and have not made new lows since.

Here's a close-up of the same two series since then:


Notice that there are two peaks, coinciding with the original, and extended, end dates for the $8000 housing credit. Notice that permits fell immediately in May and have stayed in the same range in the two months since. Starts, as per usual, lagged one month.

Now here is a graph showing purchase mortgage applications from the mortgage bankers association from the same time period as the second permits and starts graph above:


Notice that purchase applications fell off a cliff immediately after the April 30 deadline, and have been in a range since the beginning of July.

This morning, new home sales followed the same pattern. After surging to (all months revised) 414,000 in April, they fell to 281,000 in May, rose to 315,000 in June, and fell back to 276,000 in July (sorry, no graph).

Now here are existing home sales. The graph covers a longer time period, but the two peaks and subsequent swan dives after the expiration dates of the housing credit are obvious:


Home sales declined in June, but the real force of houses that went under contract after the April 30 ending of the $8000 tax credit wasn't felt until July (exactly as CR said). If that isn't good enough for you, then consider Prof. Dean Baker of "Beat the Press", who isn't exactly a raging optimist, who said, "Economists With a Clue Were Not Surprised by the July Plunge in Home Sales" , noting that they came, on schedule, about 6 - 8 weeks after the plunge in mortgage applications.

While I can't swear that August existing home sales won't be worse than July, they probably won't be substantially worse. Furthermore, because sales are seasonal, it is perfectly possible that December - February will be worse than this. What I think is just about certain is that this is the seasonally adjusted bottom taking place right now, perhaps including next month, a bottom that was delayed a year by the housing credit. Which will differentiate 2011, which will likely feature slowly rising sales with still-declining prices, from the 2006-08 period during which both sales and prices were declining.

But anyone who says that home sales are "collapsing" as an ongoing event is either ignorant or is getting their kicks by being the host of the Circle Jerk of Doom, or both.

Yesterday's Market


Notice the large number of failed rally attempts over the last 10 days; prices have just had a hard time getting beyond the 10 and 20 minute EMA.


Yesterday we have another gap lower, making five in the past week and a half.


The EMAs are now turning bearish (a), with the shorter crossing below the longer (especially the 200 day EMA). The A/D line hasn't seen a big exodus of money yet (b), but the CMF is starting to show people leaving (c). In addition, momentum is clearly waning (d).


\Prices are at clear support levels (a).


Notice that prices yesterday hit upside resistance at the 200 minute EMA three times.

Simply put, the market has a clear bearish tilt right now. Don't expect to see rallies maintain momentum beyond the 200 day EMAs.


Further confirming the bearish tone of the stock market is the bond market's rally, which is still in full force. The long-term uptrend is still in place (e) and the EMAs are still very bullish (a). Money is flowing into the market (b and c) and there is clear momentum (d).


After peaking at the end of April (a), lumber prices tumbled (b) and are currently consolidating losses (c).


Copper prices are correcting. They have either formed a flag pattern (b) or a downward sloping pennant pattern (c). Momentum is moving lower (d).

Copper could still be in a simple correction from their recent rally as prices have yet to break below major support. However, with the weakness in the housing market, I have to wonder how strong copper can be going forward.

14% Mortgage Rates? The Silly Season Continues

Further to my recent article about 8% interest rates being talked up by a story drought riven media, it seems that further "silliness" abounds; there is now talk about 14% mortgage rates within two years.

Darren Cook, of Moneyfacts, is quoted in The Telegraph (which should know better than to spread nonsense like this):

"It is unlikely that the banks will have fully repaired their balance sheets before 2012 and even more likely that some of the banks will have not repaid their debt to the taxpayer. If this warning of a Bank Rate at 8 per cent does materialize and banks retain large margins on lending, it will not be a surprise to see mortgage rates go up to 12 or 14 per cent.

I would hate to think what overdraft, credit cards and personal loan interest rates will look like at the same time
."

Interest rates will not hit 8% in two years...PERIOD!

The economy is fucked, and will remain weak for some considerable period of time.

This is a scare story being whipped up by the media, who have nothing else to write about.

Tuesday, August 24, 2010

Business Investment, Consumer Spending And Current Economy

From the Washington Post:

Many Democrats say the economy needs more stimulus. Business lobbyists and their Republican allies say it needs less regulation and lower taxes.

But here in the heartland of America, senior executives say neither side's assessment fits.

They blame their profound caution on their view that U.S. consumers are destined to disappoint for many years. As a result, they say, the economy is unlikely to see the kind of almost unbroken prosperity of the quarter-century that preceded the financial crisis.

Across the industrial parks and office towers of the Chicago region, in a more than a dozen interviews, senior executives said they see Americans for years ahead paying down debts incurred during the now-ended credit boom and adjusting spending to match their often-reduced incomes.

"It's a different era," said Daryl Dulaney, chief executive of Siemens Industry, which has 30,000 U.S. employees who make lighting systems for buildings and a wide range of other products. "Our hiring and investment decisions have to be prudent and reflect that."

Executives see little evidence that the economy is slipping back into recession. But they describe a business environment in which sales come in fits and starts and their customers can't predict what they will want to buy in the future.

"In the past, our customers had more long-term vision on what they're going to need," said Bill Larsen, president of Larsen Packaging Products in Glendale Heights, Ill. Now, he said, "they don't know what they're going to need and when they're going to need it."

I think this article/perception really explains a great deal about the current economic situation. First, the latest Senior Loan Survey from the Federal Reserve noted that loan demand is still weak. As the article highlights, businesses see little need to take out loans because they see a weak economy going forward.

NDD hit on a big part of it yesterday -- the paying down of debt and how that is impacting growth going forward. Consider these charts from the St. Louis Federal Reserve:


First, this chart is exponential. Total consumer debt outstanding has increased at a more or less consistent rate until this recession. Now the growth has dropped a bit as households pay down their debt. This drop in debt has occurred in both mortgage and revolving credit (neither of the following charts are logarithmic to better highlight the severity of the contraction in both):


As a result of this decrease, households are under less financial stress:


It's important to note that despite the decrease in consumer debt, the economy is seeing some increase in PCEs.


Total real PCEs are clearly off their lows, although recent revisions have placed them below the peak of the last expansion.


Real spending on services has increased slightly, but is better characterized as having dropped and leveled off. These comprise about 65% of total PCEs.


Real spending on non-durables has increased from its post recession lows, as has


Spending on durable goods.

The money for this spending is coming from increased savings:


In short, the consumer is spending, just not as robustly as before. And his paying down debt is a key part of the slowdown.

No, Really, Austerity Doesn't Work

From the FT:

The eurozone’s growth spurt lost momentum this month, as an expansion in output in Germany and France failed to make up for a near standstill elsewhere in the 16-country region.

A closely followed barometer of business activity on Monday pointed to a slower but still solid expansion in private sector activity, with the region’s prospects hanging largely on Germany and France, its two largest economies.

The purchasing managers’ indices are regarded as an early indicator of business trends, and the latest readings contained some hope of growth continuing at a brisk pace, even if the US economy slows.

But they intensified worries that the region will be marred increasingly by weaker growth in the peripheral eurozone countries such as Spain and Greece, where fears remain over the stability of public finances


I realize that abject stupidity is becoming the currency of political discourse on both sides of the aisle, but really, the whole austerity thing doesn't work.

Here's a chart of the data from the same article:

Yesterday's Market


Click for a bigger chart.

Prices gapped higher at the open (b), but hit resistance 108.5 and reversed, rallying into the 10 minute EMA (d) before hitting support t a low established last week (e and e). Prices twice tried to rally through the EMAs but couldn't get much beyond (f and g), so they sold off at the end of trading (h) on increasing volume.


In the last 8 days, we've had four gaps lower (a, b, d and e) and one gap higher (c). Also note that after the gap higher, prices hit resistance at the 200 day EMA which they could not get beyond.

In other words, the overall tone of the market is bearish right now.


One of the things I find really interesting is how the oil market has been stuck in a range for the last few months. Notice that after breaking through the $80/bbl area (a), prices fell back just as quickly (b), printing some very strong downward sloping bars. Now the EMAs are bearish with the shorter EMAs below the longer EMAs and prices below the EMAs pulling the EMAs lower. Also note the MACD has given a sell signal and momentum is clearly leaving the market.


Corn has risen in sympathy with the wheat market. Prices have moved through key resistance levels (a), but have upside resistance with line (b). Also note the EMAs are rising and there is a fair amount of space between them. There is also plenty of momentum (d), and a bit of upside left.


Soy beans -- which had been rising with wheat -- have broken their uptrend (a) and have printed some strong lower bars (b). While the longer EMAs are still rising, the shorter EMAs (the 10 day EMA) has turned lower, and the MACD has given a signal (d).


Cotton is still in a strong uptrend (a) which has consolidated gains (b) during the rally. Also note the strong EMA picture (c) although the MACD is close to giving a sell signal.

Share

Twitter Delicious Facebook Digg Stumbleupon Favorites More