logo

Friday, May 4, 2012

Employment Report -- "Healing Slower Than Paint Drying"

From the BLS:

Nonfarm payroll employment rose by 115,000 in April, and the unemployment rate was little changed at 8.1 percent, the U.S. Bureau of Labor Statistics reported today. Employment increased in professional and business services, retail trade, and health care, but declined in transportation and warehousing.
OK -- that alone is enough for me to say "underwhelmed."  Essentially, we're already back to a period where we're growing, but barely.

From the household survey, we do have some good news.  The long-term structural issues -- long-term unemployed, employed part-time for economic reasons etc.. -- are stabilizing.

The establishment survey shows gains in most areas -- professional services, retail trade, health care and manufacturing.  The problem is the gains simply aren't enough to indicate that the economy is healing at a "faster than paint drying" pace.

As to the workweek and wages, we have this:

The average workweek for all employees on private nonfarm payrolls was unchanged at 34.5 hours in April. The manufacturing workweek edged up by 0.1 hour to 40.8 hours, and factory overtime rose by 0.1 hour to 3.4 hours. The average workweek for production and nonsupervisory employees on private nonfarm payrolls was unchanged at 33.8 hours. (See tables B-2 and B-7.)

In April, average hourly earnings for all employees on private nonfarm payrolls rose by 1 cent to $23.38. Over the past 12 months, average hourly earnings have increased by 1.8 percent. In April, average hourly earnings of private-sector production and nonsupervisory employees rose by 3 cents to $19.72. (See tables B-3 and B-8.)
Again -- a very slow and painful healing process.
-----------------------
NDD here with some additional comments:

While the headline number was poor compared with recent reports, the internals were actually pretty good.

Let's start with the leading indicators in the report:
  - the manufacturing workweek increased by 0.1 hours
  - temporary help added 21,000 jobs
  - manufacturing employment went up 16,000 jobs
  - while construction decreased slightly, -2,000, for the third month in a row, building materials and garden center jobs increased.  This is added evidence that the housing market is slowly turning.

Other good news: 
  - both February and March were revised higher.  This is what happens in recoveries, not heading into recessions.  February's number is now +259,000.  March is now +154,000.
  - aggregate hours increased 0.1 to 96.0.  This is again confirmation of an improving job situation.
  - U3 unemployment dropped to 8.1%.  You probably recall my graphs showing that the initial jobless claim rate leads the unemployment rate, and that an unemployment rate under 8% was likely within the next few months.

There was some tepid or disappointing information as well:
 - average hourly earnings only increased by one cent.  YoY hourly earnings have only increased 1.8%.  Absent mortgage refinancing, where exactly is continuing spending going to come from?
 - the broader U6 unemployment rate, which includes involuntary part time workers, was flat at 14.5%
 - the household survey actually showed a loss in jobs for the second month in a row, down 169,000.  While this series is more volatile, it does have a tendency to lead at turning points. This is an important sign of weakness.
 - more government layoffs, -15,000. Teachers and firefighters are consumers too.
 - the labor participation rate dropped 0.1% to 63.6%. Those not in the labor force increased 522,000.  This is sure to continue the debate about how much is due to Boomer retirements vs. discouraged workers.

All in all, the internals were better than the headline, especially as to leading indicators, but there were several yellow flags.
King Rewrites History

Sir Mervyn King, Governor of The Bank of England, has stirred up a hornets nest after his recent BBC radio lecture in which he rewrote history and his/the Bank's role in the financial crisis.

Amongst other things, King said that the Bank would be very happy to co-operate with another inquiry into the collapse of Northern Rock (the bank that the Bank of England refused to bailout).

This willingness to co-operate rather took the breath away of Andew Tyrie, chairman of the Treasury Select Committee, who said that the Bank "should get on with it at the first available opportunity".

Others on the Select Committee expressed astonishment at the Governor's comments, given that the Committee has asked the Bank on numerous occasions to co-operate with an inquiry only to have their requests refused. The Bank remains the only member of the tri-partite system not to have published a review into its role in the crisis.

Morning Market Analysis


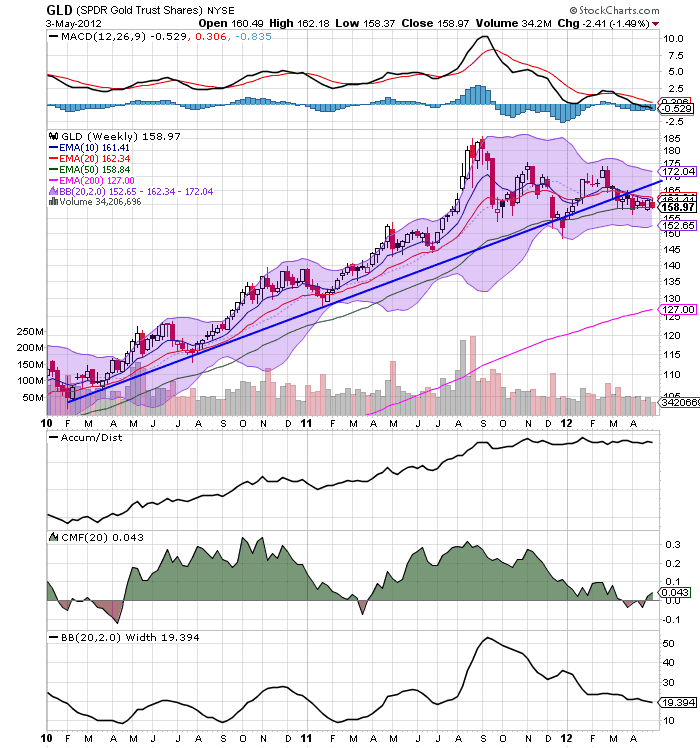
Despite breaking the long-term trend line earlier this year, gold prices are still finding support at the 50 week EMA.  But, momentum is still weakening and money flowing into the market is weak.


The gold ETF is trading at the 50% Fib level established from the rally of January 1 - Feb 29.  A move below the 157.5 area would make the January 1 level the natural, short-term price target.


The equity markets are still in a constrained position.  The IWMs and SPYs are trading in a range, (78-84 and 136-142.5, respectively), while the QQQs are below late February/early March levels.  Most importantly, on all three charts we see declining momentum over the last few months, which is not positive going forward.


Despite the recent 50 BP rate cut, the Australian market is still trading in a pretty tight range.  Prices have moved lower, finding support at the 10 day EMA, but momentum is pretty weak, and the volume indicators aren't showing much pop. 


Thursday, May 3, 2012

Professor John Taylor Is Wrong Regarding Economic History

Professor John Taylor has been writing about the weakness of the latest recovery (which, admittedly, we all have).  However, he continually compares the current recovery to the Reagan recovery.  I would argue that he is wrong in this comparison for the reasons listed below.

First, see his latest post on the subject here, where he compares the potential and actual GDP growth of the 1980s and the 2000s, along with the growth rate of real GDP.  He makes the same comparisons here.

There are several problems with this comparison, the first of which is the cause of each respective recession.  The recession of the early 1980s was caused by the central bank raising rates to lower inflation, as evidenced by the following chart:

 
The above chart compares the effective federal funds rate (left scale) with the year over year rate of inflation (right scale)  Note especially the spike in the federal funds rate starting in 1981, when Volcker kept the interest rate incredibly high to lower inflation.  This had two effects.  First, it was a primary cause of the second recession which started in mid-1981.  Secondly, it clobbered inflation by the mid-1980s.

Compare that to the start of this recession, which was started by a near collapse of the financial system.  Taylor admits that causal relationship in this post, although he argues that government intervention made the situation worse (which I disagree with).  A great explanation of the events leading up to first round of the crisis is presented in the following video:


Simply put, the causation of each respective recession is entirely different.  The recovery from the Volcker style recession is far easier to deal with: the fed lowers interest rates, which increases demand and thereby increases economic activity.  This relationship is part and parcel of economic knowledge (for a simple explanation, read Martin Zweig's Winning on Wall Street).

The recovery from a financial system shock is far more complicated.  First, while the Fed may lower interest rates to simulate the economy (which happened), the transmission system for that policy action was greatly hampered.  Consider the following charts from the FDIC's quarterly banking profile:

In 2008, the banking system was awash in bad loans. The top chart shows quarterly net charge offs for the banking sector, along with the change in non-current loans.  These figures continued to increase until the end of 2009, and were still high in 2010.  The loss provisions/net charge offs chart show the same thing -- that financial intermediaries were in serious trouble for the first 2-3 years of this recovery, meaning they could not transmit monetary policy (by making more loans) into the economy in nearly as effective a manner.

Just as importantly, the demand for loans during the latest recovery was far lower.  Consider this chart comparing total household debt outstanding and total nominal personal income:


In the early 2000s, total household debt became larger than personal income, meaning there was more household debt in the economy than income.  Put another way, the household debt/personal income ratio increased to over 100%.  This means that households were incredibly indebted, and thereby unable to take out additional loans.  Also note that since the start of the great recession total household debt has been decreasing, telling us that households are not talking out more loans, but instead paying that debt off.  Or, put another way, not only are banks unable to make loans because of a hampered financial condition, but consumers are paying down debt instead of increasing their debt.  This further hampers the transmission of Fed policy because loan demand and supply is simply weaker.

The current recovery is best explained by this paper from Irving Fisher, titled The Debt Deflation Theory of Great Depressions (PDF).  As such, The  most appropriate time comparison is the the Great Depression, especially considering the severity of the financial shock that caused the recession.


For the above stated reasons, Professor Taylor's comparison to the 1980s economy is wrong. 


Great interview with Jamie Galbraith on income inequality


- by New Deal democrat

Terrific interview by Brad Plumer of the Washington Post with Prof. Jamie Galbraith on his extensive research,  here. It's global, it is concentrated in just a few sectors, it has a lot to do with finance, and it is correlated with high unemployment, among other things.

(P.S. You could copy and paste as much as you can get away with, summarize the rest, insert BREAKING in the title, and probably get yourself on the Wreck list at DK.)

It's All Greek

Those of you who expect that the Greek elections this Sunday will resolve the uncertainty over Greece keeping to the bailout conditions and remaining in the Euro will be severely disappointed.

It is widely expected that the results will bring chaos, and that more elections will be necessary later this year.

Whatever the results of the elections, Fitch are of the view that out of the alternative scenarios a Greek exit is the most likely.

Housing Prices: a rebuttal to Barry Ritholtz, part 3


  - by New Deal democrat

As I said in part 1 of this series, Barry Ritholtz' argument that house prices will decline further rests generally on three arguments:
     (1) housing is not actually affordable by traditional measures.  Down payments remain unrealistically high, and buyers cannot qualify for mortgages;
     (2) there is a large overhang of "shadow inventory" most especially including but not limited to foreclosures, which are primed to put renewed downward pressure on prices; and
     (3) potential buyers, especially younger buyers, are fearful of the potential immobility that comes with owning a house vs. renting.


In part 2 I addressed the affordability issue.  In this part let's look at the issue of shadow inventory.

At least as far back as two years ago, based on data showing the mortgage resets and recasts peaking in the 2010-12 time frame, commentators were calling for a foreclosure tsunami to strike imminently.  That prompted me to keep score of Realty Trac's monthly foreclosure report.  It quickly became clear -- even before the robosigning scandal broke -- that no such tsunami was materializing

At the end of 2010, I asked if it was time to start looking for the end of the housing bust?, concluding that
My best guess is that the national low for the Housing Bust is still several years away.

Yet the low real prices and declining inventory in some of the most severely impacted cities argues that we should start to look for a bottom in at least some of those locales within the next 6 to 12 months.
Sure enough, the first of the 20 metro areas tracked by the Case Shiller index bottomed the next June, and by the end of 2011 seven of the metro areas appear to have bottomed.

In mid 2011, based on second derivative improvement in list prices (i.e., less bad declines),  I said that
housing prices have already "faced the brunt of market forces" without support for a full year, as a result of which they have been falling closer and closer to equilibrium, the rate of decline is abating, and actual real time data shows that nominal if not inflation adjusted stability may indeed be reached as soon as early next year.
When this was published in June of last year, one of the very first comments was
What the author fails to consider is the enormous shadow inventory held by the banks which, at some point, will either hit the market or be bulldozed due to vandalism or deterioration from lack of regular maintenance.
A similar scenario has played out month after month since then.  The YoY comparisons in list prices got ever less negative, and finally turned positive at the end of November.  Every month I would point this out.  Every month I would be told that shadow inventory was all set to overwhelm the market.  Well, here we are almost a year later, and as I discussed last week, all of the list prices indexes and all but one of the median/mean sales price indexes appear to have bottomed.  Additionally, one of the repeat sales indexes has bottomed, although the most famous - the Case Shiller index - is still down on a YoY basis.

In other words, month after month for at least two years now, the fabled foreclosure tsunami has failed to appear - including in the months before the robosigning scandal ever appeared - and for months leading up to the federal mortgage finance settlement as well.  The settlement was signed on April 5, so we are running out of excuses for the so-far-iinvisible tsunami.

As to foreclosures, Barry Ritholtz's argument is
For the past year, while the Robosigning giveaway settlement was being negotiated, Banks had voluntarily stopped most of their foreclosure machinery. Those departments have since been revamped (now, mostly legal !) and are starting to process delinquencies and defaults again. Thus, we should expect to see a significant increase in foreclosures as a percentage of total existing sales (in 2011, foreclosures were 24% of EHS).

If there is a silver lining, its that lower prices can bring out buyers....  But bargain hunting and a sustainable turnaround are two different things. There are many good reasons to believe that the 5.5 million foreclosures we have so far brings us only to the 5th inning of this real estate cycle. We are, in my best guess, barely halfway through the full course of foreclosures.
Barry makes a similar argument with regard to other "shadow inventory" and in particular those houses whose owners are "underwater," i.e., owe more in a mortgage than the house is now worth.  He says:
Shadow Inventory includes: Bank owned Real Estate (REOs), distressed homes not yet for sale, including short sales and delinquencies not yet defaulted. Various properties in different stages of Foreclosure are also in the shadow inventory.

This definition still yields a broad range of potential shadow ... inventory from 1.6 million homes (CoreLogic) to 8.2-10.3 million .... But ... I include in my definition of shadow inventory the enormous overhang of underwater homes ....

... That’s between 12 – 18 million houses as potential supply at higher prices.

The key question for the Housing Recovery case: What happens if and when prices begin to rise? .... [It] is reasonable to assume that many of these homes would be put up for sale and become inventory.
(my emphasis)
There are two important points to be made about Barry's argument. 

The first is that here Barry is actually arguing a second derivative, i.e., not the direction of prices, but the amount of increase.  He says that lower prices will bring out more buyers, but he questions if there will be a "sustainable turnaround."  Similarly he believes that more shadow inventory will hit the market "when prices begin to rise."  Thus his argument on its own terms is about the amount of a rise, not that prices will necessarily fall further with more foreclosures and/or underwater owners putting their houses on the market.

Secondly, consider the following two extreme hypothetical scenarios for foreclosures:  (1) all 10 million foreclosures are immediately processed and all come on the market in the same month; vs. (2) foreclosed properties continue to come on the market in dribs and drabs of 100,000 a month for the next 10 years.  The outcome as to prices would be wildly different.  In the first scenario, it is easy to imagine a crash in prices, that would end relatively quickly as the supply of foreclosed properties was sopped up.  In the second, the increase in the number of properties entering the market at any given time would be so small that it would likely make a very small impact on overall price, and almost certainly not change the direction at all, although its slight dampening effect would last for a very long time.

The question becomes, which scenario is closer to the truth?  Assuming the numbers to be correct - which isn't necessarily so - depending on how fast and furious foreclosed properties enter the market, there will either be a renewed downturn in price, or else there will simply be a slight dampening in the direction of prices.  If prices increase, under this scenario, the additional properties on the market due to foreclosures simply lessen the amount of the bounce off the bottom. Calculated Risk made a good presentation of the present state of foreclosures yesterday.

Given the continuing failure of the predicted foreclosure tsunami to appear for over two years now, the most likely outcome in my opinion is closer to the second one.  Foreclosures and other shadow inventory will enter the market, but at a sufficiently subdued pace that it only causes a dampening effect on price movement -- i.e., it affects the second derivative as opposed to the first.  Barry may well be right that this shadow inventory prevents a "sustainable turnaround" as additional shadow inventory enters the market "when prices begin to rise."  But that by its terms means that prices do, in fact, rise in nominal terms.

Next:  psychology and demographics

Economic wanker of the day


  - by New Deal democrat

"recessions are not a bad thing - they are simply the pause that refreshes the economy."
Lance Roberts, Street Talk Live

Tell that to the 5 million Americans who lost their jobs in the last recession and still haven't found work, you asshole.

P.S.:  Yes I do know they're not all the same people.
--------
From Bonddad:

First, I have a distinct feeling that Mr. Roberts has a high net worth and, in general, has felt no pain as a result of the last four years.

Secondly, I have a feeling that Mr. Roberts probably doesn't know anyone who has truly suffered over the last 4 years.

Third, I would add that Mr. Roberts is a self-centered and selfish ass.


Morning Market Analysis


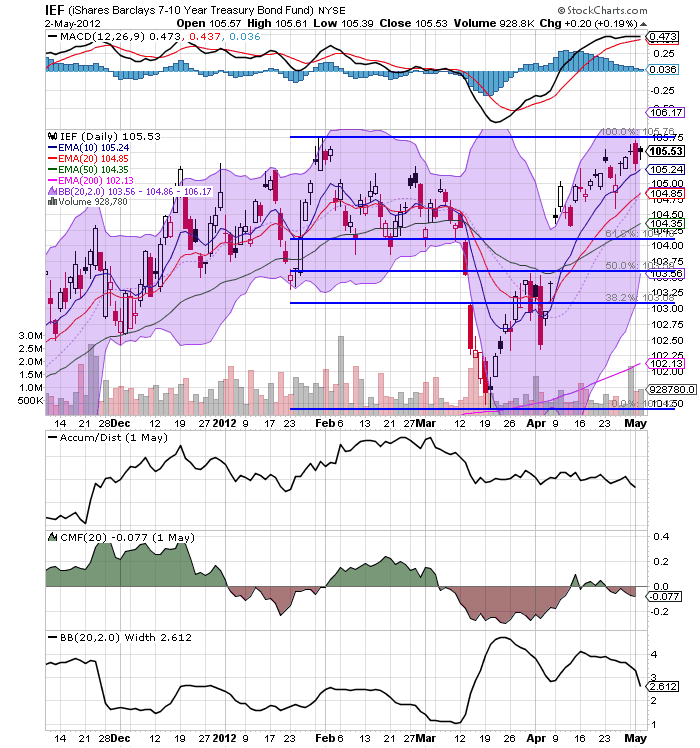
All sectors of the treasury market are still at short-term highs.  The only good news here is that the MACD's may all be about to give a sell signal.  However, even then, prices will have to drop to short-term lows before there can be any celebration.  In short, the treasury market is telling us that there really isn't much hope for a strong equity market rally soon.


Both the junk bond markets, and the high quality corporate markets are taking money as well.  Notice that both have tremendous upside room based on the lower MACD reading. 

All of these charts tell us that investors are looking for yield right now, which means money is coming out of the equity markets.


Wednesday, May 2, 2012

Share

Twitter Delicious Facebook Digg Stumbleupon Favorites More