logo

Thursday, April 5, 2012

The case for economic contraction

- by New Deal democrat

For the last couple of weeks, I've been revisiting my forecast from the beginning of the year, which was for weakness in the first half followed by stronger growth in the second. So far I have been piling up the evidence that the expansion will continue.

It's not as if there aren't some significant problems, though.

First of all, I've already touched on consumer spending in the face of increasingly high gasolilne prices, and the fact that wages haven't kept pace with inflation for over a year. As a result, people are digging into their savings, and at a more precipitous rate since the beginning of the year:


In the past, I've noted that the real personal savings rate, i.e., the savings rate minus inflation (blue in the graph below), is an excellent long leading indicator, by about 12-24 months, of GDP (red), albeit with a fair amount of noise:


Here's a close-up of the past 11 years:


The 2010 increase in real savings started to feed through into GDP towards the end of 2011. Once that is done, the real personal savings rate predicts serious trouble ahead.

Real income has stalled again, and is down slightly since December 2011. This is one of the four data series typically used by the NBER to date recessions. While not a good sign, note that the graph shows this has been a problem off and on ever since the recovery started:


Secondly, not only are consumer incomes and savings a problem, but corporate earnings (a long leading indicator) also look like they are peaking or have already peaked:


Probably not coincidentally, durable goods (a short leading indicator) look like they have rolled over:


The slowing growth of manufacturing is also shown by the ISM new orders index (blue) and vendor deliveries index (red):


Both of these are also short leading indicators. New orders in particular haven't rolled over as of this point, but could do so quickly based on past experience.

Finally, the pattern of commodity prices (green), producer prices (red), and consumer prices (blue) YoY change mirrors that we saw in both the 2001 and 2008 recessions:


At approximately the midpoint of each of those recessions, prices fell, with commodity prices - the most volatile - falling more than producer prices, which in turn fell more than consumer prices. Note, however, a couple of occasions (2004, 2006) where commodity and producer prices fell, but not faster than consumer prices. In those cases, the economy was not so weak that it went into actual contraction. The pattern of these prices - i.e., if the YoY change in commodity prices is significantly less thant the YoY change in consumer prices - will tell us in the next few months if we escape without a recession or not.

The economy does show definite signs of weakness. What remains is to add up the ledger of the positive and the negative trends I've discussed over these last couple of weeks..

Through the Eyes of The US and Australian Central Banks

I'm taking a long weekend this weekend.  So, today I wanted to leave you with some meaty reading to keep you occupied until Monday.  Consider the following statements from the Australian and US central banks regarding the overall economic situation.  All of these were released this week.

From Australia:
At its meeting today, the Board decided to leave the cash rate unchanged at 4.25 per cent.

Recent information is consistent with the expectation that the world economy will grow at a below-trend pace this year, but does not suggest that a deep downturn is occurring. Several countries in Europe will record very weak outcomes, but the US economy is continuing a moderate expansion. Growth in China has moderated, as was intended, and is likely to remain at a more measured and sustainable pace in the future. Conditions around other parts of Asia softened in 2011, partly due to natural disasters, but are not showing signs of further deterioration. Some moderation in inflation has allowed policymakers in the region to ease monetary policies somewhat. Commodity prices declined for a few months last year and are noticeably off their peaks, but have been relatively stable for a while now, at quite high levels. Australia’s terms of trade have peaked, though they remain high. 

Financial market sentiment has generally continued to improve in recent weeks and capital markets are supplying funding to corporations and well-rated banks. At the margin, wholesale funding costs are tending to decline, though they remain higher, relative to benchmark rates, than in mid 2011. But the task of putting European banks and sovereigns onto a sound footing for the longer term remains large and Europe will remain a potential source of adverse shocks for some time yet.

In Australia, growth in domestic demand ran at its fastest for four years in 2011, driven by private spending. Nonetheless the balance of recent information suggests that output growth was somewhat below trend over the year. There are differences in performance between sectors, and considerable structural change is occurring. Labour market conditions softened during 2011, though the rate of unemployment has been little changed for some time.

Interest rates for borrowers remain close to their medium-term average. Credit growth remains modest. Housing prices have shown some signs of stabilising recently, after having declined for most of 2011, but generally the housing market remains soft. The exchange rate has remained high over recent months, even though the terms of trade have declined somewhat.

In underlying terms, inflation was around 2½ per cent in 2011. CPI inflation was higher than that but will fall over the next quarter or two. It is currently expected that inflation will be in the 2–3 per cent range over the coming one to two years. This forecast abstracts from the effects of the carbon price and also embodies an assumption that productivity growth in the economy increases somewhat as a result of the structural change now occurring. At its next meeting, the Board will have the opportunity to reassess the outlook for inflation, taking into account not only data on demand and output but also forthcoming information on prices.

The Board eased monetary policy late in 2011. Since then, its judgement has been that, with growth expected to be close to trend, inflation close to target and lending rates close to average, the setting of monetary policy was appropriate. The Board's view was also that, were demand conditions to weaken materially, the inflation outlook would provide scope for easier monetary policy. At today's meeting, the Board judged the pace of output growth to be somewhat lower than earlier estimated, but also thought it prudent to see forthcoming key data on prices to reassess its outlook for inflation, before considering a further step to ease monetary policy
From the US:
The information reviewed at the March 13 meeting suggested that economic activity was expanding moderately. Labor market conditions continued to improve and the unemployment rate declined further, although it remained elevated. Overall consumer price inflation was relatively subdued in recent months. More recently, prices of crude oil and gasoline increased substantially. Measures of long-run inflation expectations remained stable.

Private nonfarm employment rose at an appreciably faster average pace in January and February than in the fourth quarter of last year, and declines in total government employment slowed in recent months. The unemployment rate decreased to 8.3 percent in January and stayed at that level in February. Both the rate of long-duration unemployment and the share of workers employed part time for economic reasons continued to be high. Initial claims for unemployment insurance trended lower over the intermeeting period and were at a level consistent with further moderate job gains.

Manufacturing production increased considerably in January, and the rate of manufacturing capacity utilization stepped up. Factory output was boosted by a sizable expansion in the production of motor vehicles, but there also were solid and widespread gains in other industries. In February, motor vehicle assemblies remained near the strong pace recorded in January; they were scheduled to edge up, on net, through the second quarter. Broader indicators of manufacturing activity, such as the diffusion indexes of new orders from the national and regional manufacturing surveys, were at levels suggesting moderate increases in factory production in the coming months.

Households' real disposable income increased, on balance, in December and January as labor earnings rose solidly. Moreover, households' net worth grew in the fourth quarter of last year and likely was boosted further by gains in equity values thus far this year. Nevertheless, real personal consumption expenditures (PCE) were reported to have been flat in December and January. Although households' purchases of motor vehicles rose briskly, spending for other consumer goods and services was weak. In February, nominal retail sales excluding purchases at motor vehicle and parts outlets increased moderately, while motor vehicle sales continued to climb. Consumer sentiment was little changed in February, and households remained downbeat about both the economic outlook and their own income and finances.

Housing market activity improved somewhat in recent months but continued to be restrained by the substantial inventory of foreclosed and distressed properties, tight credit conditions for mortgage loans, and uncertainty about the economic outlook and future home prices. After increasing in December, starts of new single-family homes remained at that higher level in January, likely boosted in part by unseasonably warm weather; in both months, starts ran above permit issuance. Sales of new and existing homes stepped up further in recent months, though they still remained at quite low levels. Home prices were flat, on balance, in December and January.

Real business expenditures on equipment and software rose at a notably slower pace in the fourth quarter of last year than earlier in the year. Moreover, nominal orders and shipments of nondefense capital goods declined in January. However, a number of forward-looking indicators of firms' equipment spending improved, including some survey measures of business conditions and capital spending plans. Nominal business spending for nonresidential construction firmed, on net, in December and January, but the level of spending was still subdued, in part reflecting high vacancy rates and tight credit conditions for construction loans. Inventories in most industries looked to be reasonably well aligned with sales in recent months, although stocks of motor vehicles continued to be lean.

Data for federal government spending in January and February indicated that real defense expenditures continued to step down after decreasing significantly in the fourth quarter. Real state and local government purchases looked to be declining at a slower pace than last year, as those governments' payrolls edged up in January and February and their nominal construction spending rose a little in January.

The U.S. international trade deficit widened in December and January, as imports increased more than exports. The expansion of imports was spread across most categories, with petroleum products and automotive products posting strong gains in January. The rise in exports was supported by shipments of capital goods and automotive products, while exports of consumer goods and industrial supplies declined on average. Data through December indicated that net exports made a moderate negative contribution to the rate of growth in real gross domestic product (GDP) in the fourth quarter of last year.

Overall U.S. consumer prices, as measured by the PCE price index, increased at a modest rate in December and January. Consumer energy prices rose in January after decreasing markedly in December, and survey data indicated that gasoline prices moved up considerably in February and early March. Meanwhile, increases in consumer food prices slowed in recent months. Consumer prices excluding food and energy also rose modestly in December and January. Near-term inflation expectations from the Thomson Reuters/University of Michigan Surveys of Consumers were unchanged in February, and longer-term inflation expectations in the survey remained in their recent range.

Measures of labor compensation generally indicated that nominal wage gains continued to be subdued. Increases in compensation per hour in the nonfarm business sector picked up somewhat over the four quarters of 2011. However, the employment cost index increased at a more modest pace than the compensation per hour measure over the past year, and the 12-month change in average hourly earnings for all employees remained muted in January and February.

Recent indicators suggested some improvement in foreign economic activity early this year after a significant slowing in the fourth quarter of last year. Aggregate output in the euro area contracted in the fourth quarter, but manufacturing purchasing managers indexes (PMIs) improved in January and February relative to their low fourth-quarter readings, and consumer and business confidence edged up. Floods caused steep production declines in the fourth quarter in Thailand and also had negative effects on output in other countries linked through Thai supply chains. However, economic activity in Thailand recovered sharply around year-end, and manufacturing PMIs moved up across Asia through February. Higher prices for energy and food put upward pressure on headline inflation in foreign economies, but measures of core inflation remained subdued.

Greece's Ever Flexible "Deadline"

On 2nd April I wrote the following:
"Oh, that's easy, Greece has yet again postponed the "deadline" (from 4th April) to 18 April!"
Well I was a little ahead of events, and was two days out on the the date.

Today Greece has announced that it has indeed postponed the deadline for remaining bondholders to accept a debt swap, the new "deadline" is 20th April.

Ever flexible "deadlines" are the tools of fools, conmen and dreamers. 

Wednesday, April 4, 2012

Welcome to Reuter's/Felix Salmon Readers

Wow!  I am very pleased to see that we have been favorably mentioned by Felix Salmon on the Reuter's Blog.  Felix is a great blogger who we have cited before.  We are extremely flattered to be mentioned by Felix and hope to continue writing quality material that holds to his high standards.

As for new readers, welcome.  Please look around and bask in our wonkishness.

Bonddad and NDD


1955: Interest Rates, Inflation and Fed Policy


Remember that during 1955,  the economy was growing at very strong rates.  As the economy expanded, businesses increased their borrowings.  In addition, as the economy expanded, the Fed became more and more concerned with inflation.  This is the reason for the increase in the discount rate during the year.  Consider the following excerpts from various rate decisions by the Fed:

From April 13: 


August 3:


November 17:


However, prices were in fact pretty contained:


The bottom whole sale price chart shows that crude goods were decreasing in price.  The real price pressure was coming at the intermediate price level, but producers were able to absorb that cost, as evidenced by the slow rise of finished goods prices.  The top chart shows that food prices were dropping sharply, while other prices were moving higher.


Consumer prices were also pretty contained.  The primary area where we see an increase are in services, which is to be expected; this year -- and this decade -- saw a tremendous increase in service usage on the part of consumers.  As the US started to form households, they purchased more and more goods such as dry cleaners, yard services etc....

Can The US Lead the World In Growth, Pt. 2 PCEs

Yesterday, I looked at investment as a contribution to GDP and argued that business and equipment investment should be able to contribute to growth, but that CRE and residential investment were probably out.  I should also add that with the rest of the world slowing down, exports can't really contribute to growth for obvious reasons. And with the new found love of austerity, it's doubtful we'll see any major public initiatives in the future. As such, that leaves US consumers as the last salvation.

So, let's start with where the consumer is now, by looking at real PCEs.


Overall, real PCEs have been rising since mid-2009.  Aside from a leveling off in growth in early/mid 2011, we see that total PCEs have continued to increase.


Real durable goods purchases -- which only account for about 12% of all PCEs, have risen strongly, especially in the last six months.  


Real non-durable goods purchases, however, haven't risen at all.  These account for about 20% of PCEs.  


Services are at strong levels -- higher than the previous expansion - and they rose strongly last month.  However, for the five months prior to that, we see a leveling off in growth.  This occurred when there was concern in the US about an overall slowing in the economy as a whole.


Real retail sales are also increasing.  However, like the service component of PCEs, we see a leveling off over the the summer/end of 2011 as there was a concern about an overall slowdown in the economy.

The above information reveals some very interesting information.

1.) The stalling in non-durable goods tells me that consumers are doing two things: first, they're making do with less.  Whereas they previously were more inclined to purchase an additional piece of clothing when it was on sale regardless of need, they are now making very tough choices and refusing these purchases.

2.) Consumers are doing more things for themselves.  I think the stalling in service expenditures last year is a sign that consumers are doing their service work themselves -- they're fixing their home themselves or doing their own yard work etc... 

3.) The rise in durable goods purchases tells me that consumers are only purchasing those goods that they absolutely need -- like autos and appliances.  These purchases are receiving the bulk of consumers discretionary purchase attention.

Now- -- can we continue to see an increase in PCEs to such a degree that the US consumer continues to drive growth?  In order for that to happen, we need to see the following happen.

1.) A continual improvement in the employment picture. First, we need to see initial unemployment claims remain at least at current levels:


The 4-week EMA of initial unemployment claims has been below 400,000 since the beginning of the year.   At minimum, we need to see these levels continue on going forward.  In addition,


The public needs to see continued improvement in the unemployment rate.

In addition, we need to see real wage gains.  Unfortunately, because of high unemployment, we're not seeing this number advance.  Consider the following measures:


Average hourly earnings of production workers -- while seeing an increase -- is still seen a weak and declining YOY percentage change.


Real compensation per hour has also stalled for the last three years.


Real disposable personal income has declined for the last two months; overall, the figure for the last five months has been in a very narrow range.  And before that, we also don't see much growth. 


The YOY percentage change in real DPI has been incredibly weak.


During the recession, we saw a big increase in savings.  For the duration of the recovery, that number has been fluctuating between 4 and 6 percent and is currently declining.  This is the source of some of the consumer spending.  In addition,


Consumer credit outstanding is on the rise, providing liquidity for consumers.

It's possible we could see the following: consumers continue to tap their savings and consumer credit to increase purchases.  But central to this is the need to continue to see improvement in the job market.  If the unemployment rate continues to drop, we will see a boost to consumer confidence, which will in turn lead to increased purchases.  However, a slowdown in the employment figure would be fatal, lowering confidence and limiting consumer purchases.


Big Society Capital

David Cameron has finally defined the "Big Society", and put "his" money where his mouth is, by launching the Big Society Capital.

This a bank that will lend money to charities and community groups. It is funded with £400M stolen by the government from dormant bank accounts, and by £200M funded by other banks.

Morning Market Analysis


The daily SPY chart shows that prices are still in an uptrend, with bullishly aligned EMAs.  But while the A/D line is increasing we see a decrease in overall momentum. There are several short-term levels of support, one at 140.60 and the second at 139.6.


The 60 minute chart shows that prices are in a slightly upward sloping consolidation pattern, trading between 139 and 142.


The 60 minute QQQs chart shows two important levels.  The first is that prices have been trading between the 67.25 and 68.50 level for the last week and a half.  Secondly, below that level, we see support in the 66.75/67/25 area.  Also note the declining momentum reading in the MACD.


The dollar is trading between (roughly) 21.80 and 22.3 and is currently revolving around the 200 day EMA.  Until we see a move above or below these levels, this chart is a bit less important in the overall analysis.


All parts of the treasury curve show the same thing: prices sold-off, rebounded to a Fibonacci level and then continued their sell-off on the release of today's Fed Minutes.

Dropping treasury prices should help to send stocks higher, as treasuries have been taking the safe money out of the market. 

Tuesday, April 3, 2012

Can the US Drive World Growth? Pt. I Domestic Investment

Last week, I noted that the rest of the developed world is slowing down (see here, here, and here).   As we are still the largest economy in the world (the next largest country is China at about $5.8 trillion in size), our ability to drive growth clearly exists.  The question is, "can we?"

First, let's look at where we've growth in this expansion by looking at the individual sub-parts of GDP.


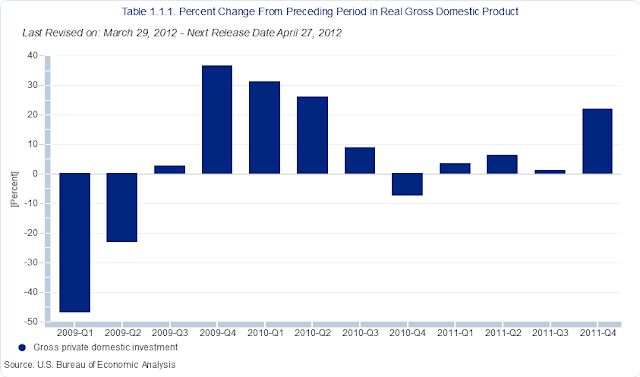
The above chart shows gross private domestic investment.  This was important coming out of the recession (largely because of inventory adjustments).  The rate of growth died down a bit, but it returned last quarter.  Let's look at the sub-parts of this data.


The real stand-out in this data is the investment in equipment and software (the gold line) which was very strong in 2009, and somewhat weaker in 2010 and 2011, but still good.  The blue line represents commercial real estate,.  We're seen two good quarters of growth over the last four; before that (2010) we still see some increases.  And then there is residential real estate, which has been pretty weak for most of the expansion.  However, last quarter, we see a nice bump.

So -- can investment help us grow this year?

To get an idea for equipment and software investment, let's look at a couple of indicators.


Industrial production for business equipment has rebounded nicely and is now at pre-recession levels.  Also note that growth has picked-up over the last few quarters, indicating an increase in activity.


The above chart is for the industrial production of durables manufacturing,  By definition, this will also include autos, which are largely a consumer good (although don't forget the importance of light and heavy trucks for business).  However, this figure also includes heavy machinery.  This figure is also rising, indicating increased production.  We can safely assume that some of that increase (for the sake of argument, say 30%-40%) is caused by increased business investment.


 Durable goods orders continue to move higher.  Notice this data series is now higher than at its height in the late 1990s expansion and is approaching levels seen at the top of the last recession.  In short, businesses are still ordering long-lasting goods, which should help overall investment.


 The top chart shows that output per hour in the manufacturing sector is still growing.  This tells us that the impetus for investment is probably a bit low.  However, in the business sector, we've seen a near stalling of hourly output, telling us the need for continued overall investment.


The above chart shows total non-residential construction spending.  The big problem with this chart is the pre-recession surge, which indicates we probably still have a glut of various facilities.  While we an increase over the last half year, overall activity is still pretty low.  And with the pre-recession surge still fairly close from a historical proximity perspective, it's doubtful we're going to see this pick-up sharpy soon.

The above charts tell us that we can expect a continued increase in investment.  Durables goods orders are still increasing.  Industrial production for heavier goods continues to increase, indicating continued demand.  Business output has stalled, indicating the continued need for investment.  However, CRE appears to be overbuilt at this point.


Share

Twitter Delicious Facebook Digg Stumbleupon Favorites More