logo

Thursday, March 29, 2012

Pope To Pray For Euro

The FT reports that a press release has been sent out today by the office of Herman Van Rompuy, announcing yet another emergency eurozone summit – on April 1.
The presence of His Holiness the Pope affords an opportunity to pray for divine intervention to save the euro.

This is now seen as the most credible strategy.”
Oddly enough, the press release is not on the European Council's website!

Here is the text of the press release:
COUNCIL OF
THE EUROPEAN UNION
EN
Brussels, 29 March 2012
8255/12
PRESSE 140
Eurozone summit next weekend
Press Statement


It has been confirmed that a Eurozone summit will be held on April 1.

Due to inadvertant wording of the Treaty on Stability, Coordination & Governance, which refers to countries "whose currency is the euro", it has been confirmed that this summit will also include the heads of state or government of Montenegro, Kosovo, San Marino, Monaco, Andorra and the Vatican City, all of which use the euro.

The presence of His Holiness the Pope affords an opportunity to pray for divine intervention to save the euro. This is now seen as the most credible strategy.

Indicative programme:
11.00 meeting with the President of the European Parliament
12.00 family photo
12.30 working session
+/- 19.00 press conference

P R E S S
R u e d e l a L o i 1 7 5 B – 1 0 4 8 B R U S S E L S T e l . : + 3 2 ( 0 ) 2 2 8 1 6 3 1 9 F a x : + 3 2 ( 0 ) 2 2 8 1 8 0 2 6
press.office@consilium.europa.eu http://www.consilium.europa.eu/Newsroom
8255/12 1
EN

Wednesday, March 28, 2012

Yen At Critical Support Levels; Japan's Economy May Be In the Balance

Consider the following chart:


The above chart is a 10 year chart of the yen.  For the last four years, it has been in an upward trend.  However, it is now just through crucial support levels.   Prices have moved through the 10 and 20 week EMAs and the MACD has given a sell signal.  In short, this chart is looking to drop sharply now.

So, why the move now?  It started when, "Bank of Japan Governor Masaaki Shirakawa indicated on March 13 that the central bank will keep using monetary policy as a tool to tackle deflation."  At that meeting, the bank announced:

The central bank also said it would broaden a lending program to growth enterprises by 2 trillion yen ($24.35 billion), bringing the size of the program to 5.5 trillion yen.

In addition, the lending scheme will be adapted to access U.S. dollar reserves held at the central bank for loans denominated in foreign currencies. The BoJ also announced an arrangement to help small lenders that were ineligible under the original rules of the Growth-Supporting Funding Facility.

Speaking at a news conference later in the day, BoJ Gov. Masaaki Shirakawa told reporters that the boost to the lending program was designed to work in conjunction with the credit-easing moves unveiled last month.
It's continuing because of their weakening trade surplus.  Consider the following charts:


The balance of trade turned negative after the earthquake over a year ago, as this forced Japan to import more oil.  The current account balance -- which is a broader measure of international trade -- just printed a negative number.  In short, one of Japan's primary international advantages may be going away, which means the the yen has to drop.
Japan has lost competitiveness in a swath of industries that it used to dominate. Its automobile industry is losing out to Germany, South Korea and the United States. Japan’s automobile industry used to be competitive in cost and far superior in quality to its global competitors. But the world has changed. The yen EURJPY +0.17%  has dropped below 110 from as high as 160 against the euro. The South Korean USDKRW +0.24%  won was about ten against the yen and is now 13. Cost-cutting cannot offset such a big change in exchange rates. The U.S. auto industry cut its labor costs and debt burden through the government bailout. It is now more competitive than Japan’s.

The automobile industry is the pillar of Japan’s economy. Its decline leaves Japan’s economy nowhere to turn. Indeed, if the auto industry leaves Japan, it will become a poor country
Japan’s electronics industry, still significant to its economy, is losing out big time to its Asian competitors. Nothing hot in electronics is made in Japan now. U.S. companies like Apple AAPL +1.13%  leverage China’s manufacturing sector to turn out hot products. South Korea is embracing the vertically integrated model and churning out competitive products like Japan used to.
Nothing symbolizes Japan’s decline like its electronics industry. It was the envy of the world and had all the ingredients to take the industry into the mobile internet era. Instead, it embraced insulation and made products just for the Japanese market. Now it is almost irrelevant to the outside world. 

.....

Japan has only one way out — a massive devaluation. If the stable national debt is 120% of GDP, the yen needs to be devalued by 40% because devaluation is ultimately equal to the nominal GDP increase. The devaluation is likely to sustain 2% to 3% of nominal GDP growth for Japan beyond the repricing induced increase, which is necessary to restore Japan’s tax revenue. Deflation has caused Japan’s tax revenue to decline as a share of GDP. It can be only reversed through restoring nominal GDP. A devaluation of 40% can restore Japan’s competitiveness against Germany and South Korea, which will lay the foundation for Japan’s industrial recovery. 
Overall, it's not a pretty picture that is emerging.


ECRI unintentionally undercuts its own recession prediction

- by New Deal democrat

Several data series used in economic indicators may have special issues rendering thier signals misleading. Two important ones are both components of ECRI's Weekly Leading Index.

The first is purchase mortgage applications. Yesterday I wrote that the WLI would probably be more positive if ECRI were continuing to include its original real estate measure, the FRB's weekly H8 report. Beyond that, however, purchase mortgage applications, which have been flat to slightly declining for almost the last two years, are in stark contrast to housing permits and starts, which are at or near 3 year highs. For example, housing permits are 200,000 higher than their low point in early 2009.

The difference appears to be explained by the large number of all-cash sales, which ran at 33% in February. Purchase mortgage applications obviously don't pick up these cash sales. And it's housing itself, not mortgages, with which we are mainly concerned when we think of leading indicators. New houses have multiplier effects in construction, landscaping, appliances, tools, and maintenance which play out over several years. If there is an unusually large percent of cash sales, the multiplier effects from those are being completely missed by the WLI.

The other element of the index which may be giving a false signal, at least as far as the US economy is concerned, is the JoC ECRI industrial commodities index. This index plummeted beginning last April. It bottomed in December and has risen modestly since:


The question here is, is the index really measuring strength and weakness in the US economy, or is it actually a better barometer of the global economy? After all, prices, supply and demand for industrial commodities is set globally, not locally.

Ironically, the best evidence indicating that the JoC ECRI index is predicting an international rather than a US slowdown comes from ECRI itself, via its presentation on "Yo Yo economies" published last Friday, in which they opined:
The rising export dependence of these [suppliers of suppliers] economies, with growing involvement in global supply networks, makes it increasingly difficult for economies to decouple, especially for suppliers of early-stage goods that have embedded themselves further up the supply chain and farther away from the final consumer. This makes them highly vulnerable to the Bullwhip Effect and at the mercy of cyclical fluctuations in end-user demand growth.
[my emphasis]

First of all, the JoC ECRI index was developed 30 years ago when the US was the dominant factor in commodity usage. If the world has become much more intertwined, i.e., the market for commodities is global, and if supplier economies such as China are the largest purchasers of raw commodities, then it follows that the index is probably primarily measuring strength or weakness in these supplier economies, not in the downstream consumer economies.

Further, it is necessarily true that if supplier economies are especially vulnerable to cyclical fluctuations, then economies which are primarily consumers of end stage goods, like the US, are the least vulnerable. If supplier economies are especially unable to decouple, then it followers that consumer economies are the most likely to be able to approach decoupling.

ECRI makes this point more explicitly elsewhere in their presentation:
[D]eveloping economies are very much subject to the Bullwhip Effect, where small fluctuations in consumer demand growth get amplified up the supply chain into big swings in demand as we move away from the consumer. So, smaller shifts in end consumer demand growth translate into larger fluctuations in intermediate goods demand, and even bigger ones in input material demand, and especially, raw material prices.

Even a modest decline in consumer spending growth in developed economies like the U.S. and Europe can help trigger a significant downdraft in the level of demand from suppliers and, in turn, a serious downturn in the level of demand for “suppliers to suppliers.”
In other words, an absolute contraction in supplier countries can be caused by simply continued growth, but at a slower rate, in a consumer country. Which means that converse is also true: an observed contraction in supplier economies (like China) does not necessarily mean that there is a contraction in consumer economies (like the US). Rather, consumer economies may simply continue to grow, just at a slower pace.

As if that weren't clear enough, ECRI supplies this very helpful graph:


Unless I'm missing something, that arrow at the top for consumer countries in ECRI's diagram is still pointing UP.

So ECRI's own presentation suggests that their own indicator, the JoC ECRI commodities index, forecast a global downturn via its downdraft in the second part of 2011. But just as a recession in the US doesn't necesssarily mean a contraction in, say, Texas, so the global downturn measured by the commodities index may only have forecast slower growth in the US consumer economy.

ECRI's own presentation indicates as much. Oops!

Crisis Almost Over - LOL!

The Italian Prime Minister, Mario Monti, who is evidently something of a clown like his predecessor has claimed that the Eurozone's woes are "almost over":
"The eurozone has gone through a huge crisis. I believe that this crisis is now almost over."
Sure enough the markets have fallen as, quite rightly, they attach little credence to anything that a Euro politician says these days.

Greek Banks Have Guts Ripped From Them

Reuters reports that firms and consumers are, unsurprisingly, continuing to withdraw money from Greek banks.

Private sector deposits in Greek banks fell by 2.7%, after a 3% fall in January. Deposits at the end of February were Euro170.1BN, the lowest level since October 2006.
For why?

No one trusts the Greek financial system anymore.

Morning Market Analysis


Yesterday, the grain complex took a big hit, as traders dumped the corn contract.  Prices have now moved through the late October price level twice in the last two weeks, indicating weakness.  The big news for this market coming up is the crop report on Friday (shades of Trading Places, I realize).


Industrial metals are still bouncing between the 200 day EMA (right below 21) and the 50%/61.8% Fib level.  While we see declining momentum, the volume indicators are positive.  However, the shorter EMAs (10 and 20 days) are declining, while the 50 is just turning a bit negative.


The oil market has been trading between 104 and 110 for the last month.  Momentum is decreasing and the shorter EMAs are trading in a very tight range. 


While the other averages have broken through resistance, the transports have not.  Instead, they've been contained by resistance just north of 96.  While the EMAs are fairly shallow, the volume indicators are rising.


The treasury market is still rebounding from its low just north of 101.  Prices have moved through 38.2% Fib level and the 10 day EMA are are now right at the 50 day EMA.  The 104 price level is very important for this chart, as that is the support area of the trading range the IEFs were in for the first two months of the year.

The commodity charts should concern the bulls.  In a growing economy, we should be seeing these move through resistance -- especially the industrial metals.  However, they're treading water.  The good news is they're not falling sharply.  The bad news is they're not rallying.

The lack of confirmation from the transports is not fatal to the other averages, but it does add a sense of caution to any advance.  Finally, the rebounding treasury market can, so far, be attributed to short-term bottom fishing.  But, we need to keep an eye on where prices move.

Tuesday, March 27, 2012

How to make an economic index subjective: change it!

- by New Deal democrat

Over the last week I've been re-examining and updating my January forecast. While I believed there would be weakness in the first half of the year, I considered it unlikely that it would bring about an actual recession. This puts my view at odds with ECRI's (although it is right on point with the contrary viewpoint of the Conference Board, publishers of the official LEI's).

So why am I not persuaded by ECRI's latest arguments? A number of reasons. First of all, believing that the seasonal adjustments after the 2008 recession may be suspect isn't grounds for disregarding them and instead adopting a view based on more lagging year-over-year metrics. That simply means that the seasonal numbers MIGHT be wrong, not that they ARE wrong. So if the monthly and the YoY trends disagree, it only means that we can't be sure which is right, NOT that the YoY trend is correct.

Secondly, coincident indicators are coincident, period. They should not be interpreted as leading.

Finally, I believe that ECRI has changed the make-up over several of its indexes in the last 20 years. This reflects a subjective, editorial judgment. Where the two versions of the index diverge, extra caution is warranted. In fact, I believe ECRI is being misled by several series upon which it relies heavily, which either no longer mean what they used to for the US economy, or are having unique problems (more on which, tomorrow).

In his 1990 book, Prof. Moore listed the Federal Reserve Bank's H8 weekly release as one of the elements of the Weekly Leading Index, and it was included in the WLI as least as late as 1993 when it was publised in Business Week magazine. But by 2002 that had changed, with Achuthan telling CNN Money that
The WLI contains seven major economic indicators, including mortgage applications for purchase, money supply, sensitive industrial prices, bond yields, bond-quality spreads, stock prices and weekly jobless claims.
Does the substitution of the MBA's purchase mortgage index for the FRB's weekly H8 release make a difference? Absolutely.

Here's the PMA, currently used in the WLI. It's been flat for almost the last 2 years and has actually dipped into negative territory on a YoY basis for the last few months:


Now here is the YoY growth rate of the FRB's H8 release. It continued to decline at a decreasing rate until it turned up sharply three months ago:


This shows the H9's recent history in more detail, through February. It is now at 0 on a YoY basis.


If the FRB H8 release were still part of the WLI, there would have been a sharper decline in 2009, and the period of flatness would have ended a year ago, with an increasingly stronger move upward since.

An even more important change is the Conference Board's explicit dropping of Real M2 as a component of its index. Just as importantly, although Real M2 is included in both Professor Moore's 1992 list of the WLI, confirmed by its inclusion in the Business Week index in 1993, and reconfirmed by Achuthan in 2002, it now appears that ECRI has also either trivialized or completely dropped Real M2 as a component of its WLI in favor of credit spreads.

To show just how big a difference that makes, here is Real M2 YoY in blue, and credit spreads in red:


Here is a close-up of their wildly differing trajectories in last August and September:


Both of these were essentially caused by the same thing: Europeans fleeing European banks and making deposits in US banks and purchasing US treasuries. M1 and M2 skyrocketed, while credit spreads blew out.

Despite that, ECRI's WLI shows that it caught all of the negative blowing out of credit spreads, but apparently none of the moonshot in M1 and M2:


Indeed, if real M2 were still part of ECRI's WLI, it is hard to see how it could have gone negative at all. Add the difference in H8 to that, and it is very unlikely that ECRI would have made a recession call last year.

Beyond that, while the Conference Board deleted Real M2, it was at least transparent, and also the changes in the LEI did not change the ultimate direction of that set of indicators. In the case of the WLI, if I am correct, the decision DID change the direction of the indicators. Further, this decision was inherently subjective, a matter of human judgment.

So ECRI's recession call is not compelled by objective data. Rather, it is a function of a subjective *choice* as to which objective data were left in the index and which were not. When such a choice leads to conflicting outcomes, extra caution is warranted.

Europe Isn't Looking Too Good Right Now

Consider the following information from Markit.  This is their respective PMI for the manufacturing and service sectors in Europe.


All countries dropped at the end of last year.  Only Germany has a positive PMI -- and that is a weak reading.


New orders have been declining for the last year and are now slightly negative.


Overall, employment is weak as well, with only German showing a positive number.


Above is the latest IFO Business Climate Number from Germany.  This number appears to have rebounded somewhat, but it is still showing a weak reading.

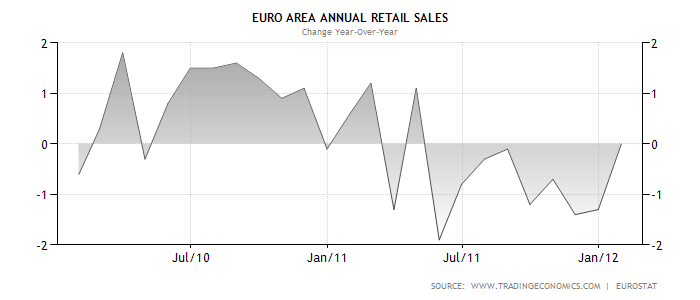
Let's look at a few macro level statistics for the region:


Overall, EU growth has been pretty low for most of the recovery.  We see a pattern of slowing for the last three quarters -- obviously not a good development.


The above five charts show a policy conundrum for the central bank.  First, inflation is right around 3% - not painfully high.  However, with oil prices rising, expect to see EU inflation pick-up a bit.  In addition, high oil prices are squeezing EU consumers, as noted by the Financial Times:


The IEA estimates that the EU will spend a record $502bn this year on net imports of oil, up from $472bn in 2011.

That represents 2.8 per cent of the bloc’s gross domestic product, whereas between 2000 and 2010 it was spending on average 1.7 per cent of GDP on oil imports.

“The current price levels are on average higher than the awful year of 2008 [when oil hit a record high of $147 a barrel], and as such have the capacity to tip the global economy back into recession,” Mr Birol said in a speech in London.

He noted that every recession in the industrialised countries since the second world war had been preceded by an oil price spike.

The oil import bill is creating an additional burden for Europe’s hard-pressed consumers.
European households will spend close to 11 per cent of income on heating, lighting, cooking and personal transport this year, compared with the historical average of 6-7 per cent and 9 per cent last year, Mr Birol said.
And consider this from the latest German Consumer Climate report:
Record prices for petrol and diesel at German petrol pumps have clearly affected the mindset of consumers in March. This is reflected by the indicator for income expectations, which decreased considerably, virtually negating the gains of the previous month
Ideally, the central bank would raise interest rates a touch to stave off inflationary pressures -- and given that rates are at 1%, there is plenty of room to raise.  But, overall EU unemployment is increasing, which is hurting retail sales on both a month over month and year over year level.

Unfortunately for the ECB, the best policy response is to hope that "high commodity prices are the cure for high commodity prices" -- that is, as oil increases in price, demand drops, thereby lowering commodity prices.  This is not the best option for a central bank.

Now, consider the equity averages of the three largest economies.


The French market is in the middle of a broadening triangle pattern, just above the 200 day EMA.  Momentum is dropping, but the volume indicators are rising.   The Bollinger Bank width is weak, indicating a period or rising volatility is probably closer than we want to think.  Prices are just above highs in the 22 area that the market reached back in late October.


The German market is very similar to the French market.  Prices have been trading in a two point range, but on declining momentum.


The British market is moving sideways, just about levels established in late October.   Here we see prices trading in a 1 point range on declining momentum.


The euro has been moving sideways since February, moving between the 130 and 134 area.   The EMAs are very tangled, preventing the drawing of any major conclusion about the future market direction.

The sum total of all the above charts is this.  Europe is weak. Unemployment is rising, which is lowering consumer spending.  This in turn is lowering overall demand, which is lowering service and manufacturing demand.  To make matters worse, interest rates are already low, so there is little the ECB can do from that end.  In addition, an oil price spike is hemming them in as well -- which is also lowering overall consumer demand. 

The lower growth environment is keeping the respective equity markets in check.  On the good side, the euro is inexpensive right now, making EU exports cheaper on the world market.  but with a weaker BRIC economic situation right now, there is the question of who would buy EU exports.  In addition, the bond markets of the largest economies are also yielding little more than the US right now, as shown in this chart:


The best chance for arbitrage above would involve the French market, but that's still not a great opportunity.

So, in conclusion, Europe is not looking that good right now.


Yen Is At Very Important Levels Right Now; Japan In Trouble

Consider the following chart:


The above chart is a 10 year chart of the yen.  For the last four years, it has been in an upward trend.  However, it is now just through crucial support levels.   Prices have moved through the 10 and 20 week EMAs and the MACD has given a sell signal.  In short, this chart is looking to drop sharply now.

So, why the move now?  It started when, "Bank of Japan Governor Masaaki Shirakawa indicated on March 13 that the central bank will keep using monetary policy as a tool to tackle deflation."  At that meeting, the bank announced:

The central bank also said it would broaden a lending program to growth enterprises by 2 trillion yen ($24.35 billion), bringing the size of the program to 5.5 trillion yen.

In addition, the lending scheme will be adapted to access U.S. dollar reserves held at the central bank for loans denominated in foreign currencies. The BoJ also announced an arrangement to help small lenders that were ineligible under the original rules of the Growth-Supporting Funding Facility.

Speaking at a news conference later in the day, BoJ Gov. Masaaki Shirakawa told reporters that the boost to the lending program was designed to work in conjunction with the credit-easing moves unveiled last month.
It's continuing because of their weakening trade surplus.  Consider the following charts:


The balance of trade turned negative after the earthquake over a year ago, as this forced Japan to import more oil.  The current account balance -- which is a broader measure of international trade -- just printed a negative number.  In short, one of Japan's primary international advantages may be going away, which means the the yen has to drop.


Japan has lost competitiveness in a swath of industries that it used to dominate. Its automobile industry is losing out to Germany, South Korea and the United States. Japan’s automobile industry used to be competitive in cost and far superior in quality to its global competitors. But the world has changed. The yen EURJPY +0.17%  has dropped below 110 from as high as 160 against the euro. The South Korean USDKRW +0.24%  won was about ten against the yen and is now 13. Cost-cutting cannot offset such a big change in exchange rates. The U.S. auto industry cut its labor costs and debt burden through the government bailout. It is now more competitive than Japan’s.

The automobile industry is the pillar of Japan’s economy. Its decline leaves Japan’s economy nowhere to turn. Indeed, if the auto industry leaves Japan, it will become a poor country
Japan’s electronics industry, still significant to its economy, is losing out big time to its Asian competitors. Nothing hot in electronics is made in Japan now. U.S. companies like Apple AAPL +1.13%  leverage China’s manufacturing sector to turn out hot products. South Korea is embracing the vertically integrated model and churning out competitive products like Japan used to.
Nothing symbolizes Japan’s decline like its electronics industry. It was the envy of the world and had all the ingredients to take the industry into the mobile internet era. Instead, it embraced insulation and made products just for the Japanese market. Now it is almost irrelevant to the outside world. 

.....

Japan has only one way out — a massive devaluation. If the stable national debt is 120% of GDP, the yen needs to be devalued by 40% because devaluation is ultimately equal to the nominal GDP increase. The devaluation is likely to sustain 2% to 3% of nominal GDP growth for Japan beyond the repricing induced increase, which is necessary to restore Japan’s tax revenue. Deflation has caused Japan’s tax revenue to decline as a share of GDP. It can be only reversed through restoring nominal GDP. A devaluation of 40% can restore Japan’s competitiveness against Germany and South Korea, which will lay the foundation for Japan’s industrial recovery. 
Overall, it's not a pretty picture that is emerging.


Share

Twitter Delicious Facebook Digg Stumbleupon Favorites More