- by New Deal democrat
The two primary proponents of the view that a new recession is beginning have been ECRI and John Hussman. As of now, we can say that Hussman's own metric invalidates his recession call, and that ECRI's initial recession call was also inaccurate.
While I have great respect for ECRI, when they made their initial recession call in September 2011, I wondered if they had misinterpreted a transient if violent downturn in manufacturing and consumer confidence, due mainly to the debt ceiling debacle and the consequent downgrading of US bonds, for typical short term leading indicators of recession. We can now say that it indeed appears to have been the case.
ECRI issued its private recession warning to clients on or about September 23, and went public with the warning on September 30. Their statement was unequivocal, Laksham Achuthan saying that recession was "imminent," and that he was
Achuthan also made it clear that he was relying not on GDP, but rather on the traditional NBER standards for determining a recession: industrial production, payrolls, real retail sales, and real personal income.
Well, the 4th quarter data is in, and here's where those four metrics stand:

All four finished 2011 at post recession highs. While certainly revisions to data are frequent, it will take some serious revising to cause enough of this data to turn negative to claim that a recession did begin by the end of last year. While subsequently ECRI backtracked and has revised the call to say a recession will begin by the end of June, their initial call must be regarded as busted.
Now let's turn to John Hussman. On August 8, 2011, John Hussman officially issued his "recession warning," saying that
As for the immediate future, the simple question is: can you really have a recession when housing (permits close to 3 year highs) and cars (sales at 3 1/2 year highs) won't play along? On a related note, this morning's initial jobless claims number of 367,000 was the first week not affected by seasonality, and tells us that the recent drop was very real. If the relationship between initial jobless claims numbers and payrolls for this recovery continues to hold, then we should expect January's payrolls report tomorrow to be similar to December's number -- generally, somewhere in the vicinity of +200,000.
The two primary proponents of the view that a new recession is beginning have been ECRI and John Hussman. As of now, we can say that Hussman's own metric invalidates his recession call, and that ECRI's initial recession call was also inaccurate.
While I have great respect for ECRI, when they made their initial recession call in September 2011, I wondered if they had misinterpreted a transient if violent downturn in manufacturing and consumer confidence, due mainly to the debt ceiling debacle and the consequent downgrading of US bonds, for typical short term leading indicators of recession. We can now say that it indeed appears to have been the case.
ECRI issued its private recession warning to clients on or about September 23, and went public with the warning on September 30. Their statement was unequivocal, Laksham Achuthan saying that recession was "imminent," and that he was
confident that the recession either began in the third quarter, which ends today, or will begin in the fourth quarter....[CNBC video with quotation embedded here.]
"We may be in a recession today already, or it may start in the next month or two."
Achuthan also made it clear that he was relying not on GDP, but rather on the traditional NBER standards for determining a recession: industrial production, payrolls, real retail sales, and real personal income.
Well, the 4th quarter data is in, and here's where those four metrics stand:
All four finished 2011 at post recession highs. While certainly revisions to data are frequent, it will take some serious revising to cause enough of this data to turn negative to claim that a recession did begin by the end of last year. While subsequently ECRI backtracked and has revised the call to say a recession will begin by the end of June, their initial call must be regarded as busted.
Now let's turn to John Hussman. On August 8, 2011, John Hussman officially issued his "recession warning," saying that
the composite of economic and financial evidence we presently observe has always and only been associated with ongoing or immediately impending recessions. This is not an opinion or a viewpoint, but a fact of the data. "Always and only" is the Bayesian equivalent of "certainty"The evidence he cited is the following composite, which he had set forth one week earlier, on August 1, 2011. The composite -- updated with my comments in italics -- is as follows:
1: Widening credit spreads: An increase over the past 6 months in either the spread between commercial paper and 3-month Treasury yields, or between the Dow Corporate Bond Index yield and 10-year Treasury yields.Now, it's possible that there are differing levels for these 4 metrics signaling "recovery" for Hussman vs. their "recession" signals as claimed above, but if so Hussman should explain what those different recovery levels are. Otherwise, as of now, two of the four necessary metrics metrics making up his composite based on which he predicted an "imminent recesson" 6 months ago have been violated. Thus the original basis for his recession warning is also no longer valid.
NDD comment: this component is still in effect, as credit spreads have not significantly improved since falling in August, but this condition may be violated in about six weeks if there is no further deterioration.
2: Falling stock prices: S&P 500 below its level of 6 months earlier. This is not terribly unusual by itself, which is why people say that market declines have called 11 of the past 6 recessions, but falling stock prices are very important as part of the broader syndrome.
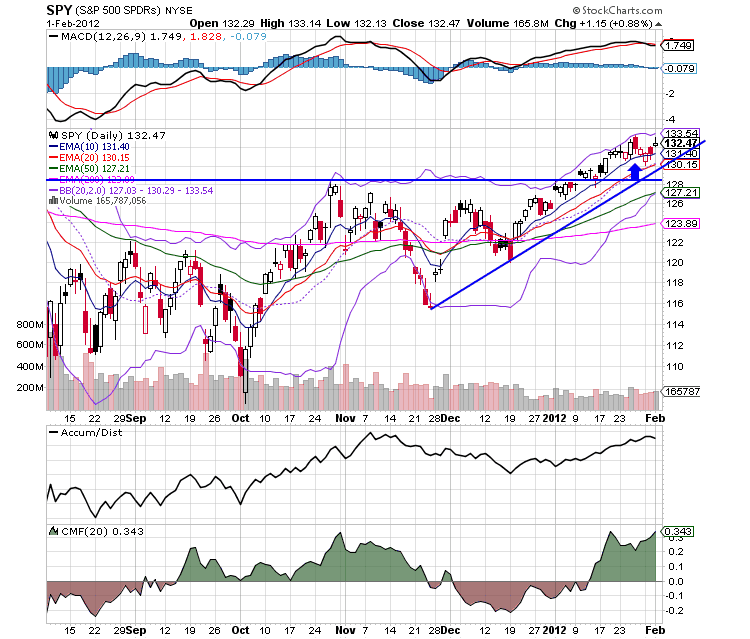
NDD comment: This condition has been violated as of one week ago. The S&P 500 is higher now than it was 6 months ago, and yesterday came within a hair of a 6 month high.
3: Weak ISM Purchasing Managers Index: PMI below 50, or,
3: (alternate): Moderating ISM and employment growth: PMI below 54, coupled with slowing employment growth: either total nonfarm employment growth below 1.3% over the preceding year (this is a figure that Marty Zweig noted in a Barron's piece many years ago), or an unemployment rate up 0.4% or more from its 12-month low.
NDD comment: This condition has also been violated as of the January ISM report of 54.1. If January nonfarm payrolls exceed 122,000, there will be a second violation as payroll growth will be more than 1.3% YoY. The unemployment rate has fallen by 1/2% in the last half year.
4: Moderate or flat yield curve: 10-year Treasury yield no more than 2.5% above 3-month Treasury yields if condition 3 is in effect, or any difference of less than 3.1% if 3(alternate) is in effect (again, this criterion doesn't create a strong risk of recession in and of itself).
NDD comment: This condition is still in effect. Of course, it was also in effect during most of the 1930's 10% YoY New Deal expansion, the entire 1940's, and the start of the 1950's -- coinciding with the strongest growth of the last 100 years.
As for the immediate future, the simple question is: can you really have a recession when housing (permits close to 3 year highs) and cars (sales at 3 1/2 year highs) won't play along? On a related note, this morning's initial jobless claims number of 367,000 was the first week not affected by seasonality, and tells us that the recent drop was very real. If the relationship between initial jobless claims numbers and payrolls for this recovery continues to hold, then we should expect January's payrolls report tomorrow to be similar to December's number -- generally, somewhere in the vicinity of +200,000.