logo

Sunday, December 4, 2011

Morning Market


Last week, oil's primary price movement occurred on Tuesday and Wednesday, when prices made an equal move higher -- they advanced on Tuesday morning, consolidated Tuesday afternoon and Wednesday morning, and then advanced an equal distance on Wednesday.  Interestingly, prices did not advance strongly on Friday when the unemployment report was printed, instead staying below the 101/101.5 level.

On the daily chart, we see the EMAs printing a very bullish outlook, but prices are still between two important levels, indicating we'll probably see consolidation for the next few weeks as traders get a better idea for the overall macro-level economic direction.


Pulling the lens back, we see the dollar was clearly in a downtrend and head and shoulders formation for 2010.  The downtrend was caused by the Fed's 0% interest rate policy and massive fiscal stimulus.  However, for the last few months, the dollar has benefited from being the "least dirty shirt in the hamper" -- especially in relation to the euro.  As such, we're seeing prices consolidate at the bottom of the downward trend.  There are two important lower levels to keep in mind -- 21 (which is right below the current lower trend line) and the lower trend line itself.


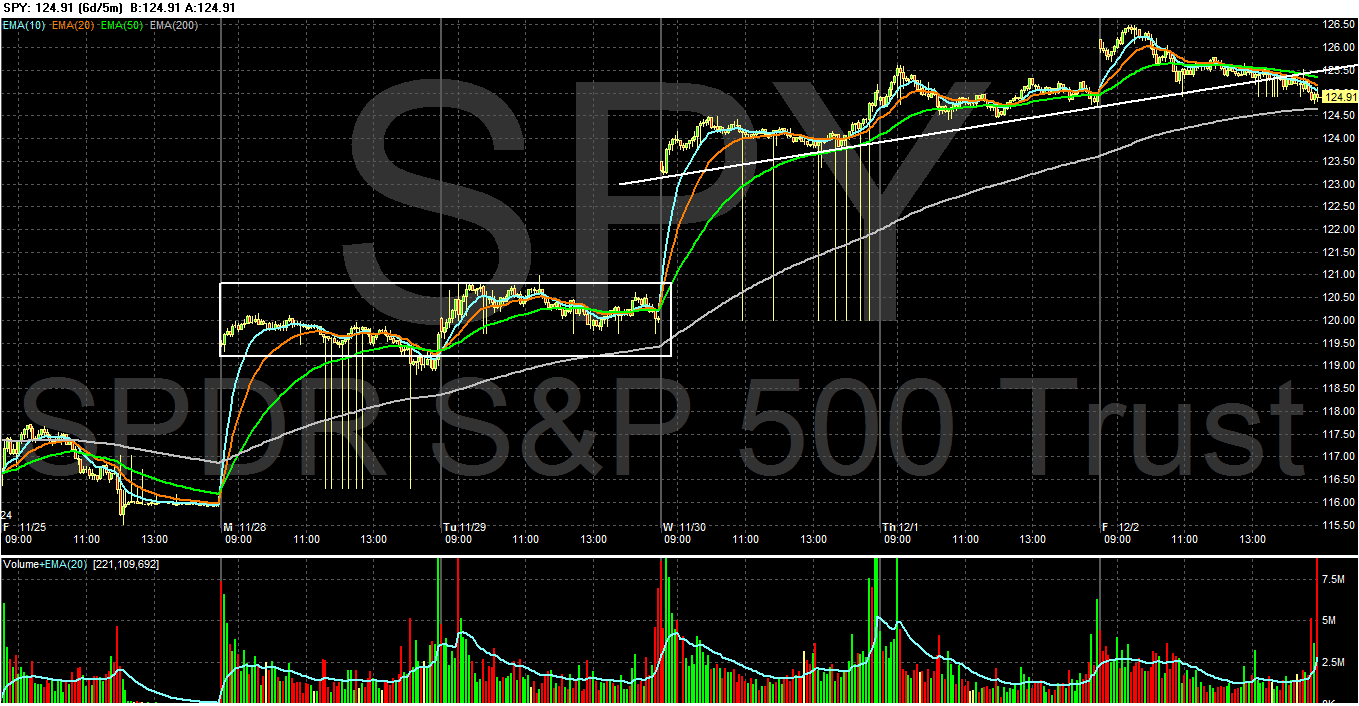
The above chart is a six day chart of the SPYs.  Prices gapped higher on Monday, consolidated for two days, then gapped higher on Wednesday due to the coordinated central bank move.  However, Prices did not move higher on Friday in response to the employment report.  Some of that may be due to the strong rally prices saw all week.   But, there were some very good points to the employment report which were economic positives.


The daily chart shows that prices are still in a consolidation trend.  And even though we had a good jobs print on Friday, prices did not follow through on the rally to break out of the consolidation trend.  Instead, prices fell back within the symmetrical triangle.

Saturday, December 3, 2011

Weekly Indicators: Asking prices for houses turn positive YoY edition

- by New Deal democrat

The big monthly number was yesterday's employment report, showing 120,000 jobs added to the economy in November. September and October were also revised up by a total of 72,000, conintuing the string of upward revisions. The household survey was even more impressive, up 278,000 jobs. The last 4 months in this survey have shown gains averaging 321,000 a month. Unemployment declined to 8.6%, the lowest since March 2009. Only half of the 0.4 decline was due to participants leaving the workforce, as to which the phrase "retiring baby boomers" assumes ever-increasing importance. Two important internals were weak: manufacturing hours, one of the 10 LEI, declined by .2. Wages actually decreased by $.02 continuing the ominous real wage deflation of this year.

In other monthly news, manufacturing improved (although vendor deliveries, another of the LEI, decreased). Auto sales were up, and at their strongest level ex cash for clunkers since August 2008. Consumer confidence rebounded strongly, taking back over half of its decline since the end of June. New home sales were flat, and the Case-Shiller index of home prices declined more than expected, althought its YoY% decline continues to lessen.

Before turning to the high frequency weakly data, let me remind new readers that this post is not designed to be a "big picture" look at the economy. Quite the reverse: if we think of the economy like a motion picture with 24 frames per second, this post compares the most recent frame with the frame just preceding. In other words, it is a snapshot of as close as we can get to the present moment. Before any change in direction in monthly data is confirmed by two successive reports, there will be at least 8 weekly datapoints, which will show the change first.

Let's start with the small sea-change in housing. For the first time since the inception of the series over 4 1/2 years ago, YoY weekly median asking house prices from 54 metropolitan areas at Housing Tracker were positive, up +0.1% YoY for the last full week of November. The areas with YoY% increases in price decreased by 1 to 20. Only Chicago continued to have a double-digit YoY% decline. The monthly number for all of November was still down -0.7% YoY, which is still the smallest monthly YoY decline since the series began. Housing Tracker's asking prices have generally led sales prices at turning points and in the second derivative by 4 to 6 months over the history of the series, so this suggests that the Case-Shiller index YoY decrease will continue to lessen in coming months, and may turn positive nominally by next summer.

Meanwhile, the Mortgage Bankers' Association reported that seasonally adjusted purchase mortgage applications decreased -0.5% last week. On a YoY basis, purchase applications were down -8.2%. This primarily reflects a multi-week spike last year vs. flatness this year. The actual reading remains firmly within the range that purchase mortgage applications have been in since May 2010. Refinancing fell -15.3% w/w. Refinancing continues to be extremely volatile.

Turning to jobs, the BLS reported that Initial jobless claims rose 9000 to 402,000. This is 14,000 above the 388,000 low of 2 weeks ago. The four week average rose 1500 to 395,750.

The American Staffing Association Index remained at 92 last week. This series continues its slight upward trajectory, but remains slightly below last year's levels.

Tax withholding for the 20 reporting days of November was significantly down from last year's levels. Adjusting +1.07% due to the 2011 tax compromise, the Daily Treasury Statement showed that for this November, $135.5 B was collected vs. $138.9 B a year ago, a decline of -2.4 B. Before concluding that the economy has suddenly weakened, however, note that this November began on a Tuesday whereas November 2010 began on a Monday. That means that this November only had 4 Mondays vs. last November's 5. Tax collections are typically stronger on Mondays and much stronger on the first of the month. Usually the 20 day moving average takes care of that issue (4 x each weekday), but because of holidays in November, that didn't apply. When I correct for this by measuring 20 days beginning Monday October 31, 2011 or Tuesday November 2, 2010, the anomaly disappears, and tax collections for the 20 day period are up $1.8 B or $1.7 B respectively, or about +1.3% YoY.

Retail same store sales remained positive as they have been all year. The ICSC reported that same store sales for the week of November 26 increased 4.0% YoY, and 1.7% week over week. Shoppertrak reported that YoY sales rose 4.4% YoY.

The American Association of Railroads reported that total carloads increased 3.9% YoY, up about 17,000 carloads YoY to 456,200. Intermodal traffic (a proxy for imports and exports) was up 6700 carloads, or 3.7% YoY. The remaining baseline plus cyclical traffic increased 10,200 carloads or 4.0% YoY. Total rail traffic has staged an impressive rebound in the last couple of months.

Money supply continues to stabilize after its Euro crisis induced tsunami. M1 decreased -0.5% last week, and is up a slight 0.2% month over month. It remains up 18.7% YoY, so Real M1 remains up 15.1%. This is about 5% under its peak YoY gain several months ago. M2 also decreased -0.4% w/w. It remained up 0.3% m/m, and 9.4% YoY, so Real M2 was up 5.8%.

Weekly BAA commercial bond rates declined .05% to 5.11%. Yields on 10 year treasury bonds fell even more, down .08% to 1.94%. In the last couple of weeks, spreads have started to widen again, representing increasing weakness.

Finally, the Oil choke collar is tightening, as Oil closed just below $101 a barrel on Friday. This about $6 above the recession-trigger level calculated by analyst Steve Kopits. Gas at the pump, however, decreased $.06 to $3.31 a gallon. Measured this way, we probably are only about $.05 to $.10 above the 2008 recession trigger level. Gasoline usage was off YoY, but by considerably less, at 8769 M gallons vs. 8867 M a year ago, or -1.1%. The 4 week moving average is off -2.9%, which is also less of a decline compared with recent weeks.

With the vital exception of real wage deflation, the picture now is very similar to that of a year ago. Having dodged a double-dip recession, the economy then showed signs of becoming a self-sustaining recovery, only to be strangled by the Oil choke collar (with an assist by the tsunami in Japan) in March. It looks like we've dodged another bullet, but the Oil choke collar is tightening again.

Have a nice weekend.

The Naked Greed of Banks

Banks still seem to be operating with their heads in the sand.

"A customer borrowing £100 for 28 days without the consent of Santander would repay £200, for example.

That is the equivalent annualised percentage rate, or APR, of 819,100%.

Comparisons between banks and so-called payday lenders showed that the annualised percentage rate charged for borrowing £100 over 28 days varied from 969% to 819,100%.....

No payday loan lender charged an APR of more than 5,000% but two banks - Santander and Lloyds TSB - charged an equivalent APR of more than 300,000%. 

Santander told the BBC: "It's is confusing to compare payday loans with overdrafts on current accounts because an unauthorised overdraft charge is for unauthorised use of a current account while a payday loan is an agreed loan facility."

Barclays would charge a customer using a personal reserve - a pre-agreed emergency borrowing facility - £22 for every five consecutive working days they were in it. This means customers would pay £88 on top of the £100 capital after 28 days - an equivalent APR of 366,000%."

Source BBC

Friday, December 2, 2011

Unemployment at 8.6%; Jobs Up 120,000

From the BLS:


The unemployment rate fell by 0.4 percentage point to 8.6 percent in November, andnonfarm payroll employment rose by 120,000, the U.S. Bureau of Labor Statisticsreported today. Employment continued to trend up in retail trade, leisure andhospitality, professional and business services, and health care. Governmentemployment continued to trend down.
So far, so good. Now let's look at the details:


In November, the unemployment rate declined by 0.4 percentage point to 8.6 percent.From April through October, the rate held in a narrow range from 9.0 to 9.2 percent.The number of unemployed persons, at 13.3 million, was down by 594,000 in November.The labor force, which is the sum of the unemployed and employed, was down by alittle more than half that amount.
This takes a bit of an explanation. The unemployment rate is derived from the household survey, which gives us several important employment numbers. First, we get the civilian labor force, which comprises the denominator of the unemployment fraction (The civilian labor force is the total number of employed and unemployed people in the country). This amount decreased by 315,000. In addition, the number of employed in the household survey increased by 278,000 while the number of unemployed decreased by 594,000. Finally, the "not in the labor force" number increased by 487,000 (also remember that this number is horribly misunderstood and misrepresented. The increase could have just as easily been caused by an increase in the number of people retiring as from people giving up looking).

So putting this all together, we get the following:

More people are working (+278,000)
Fewer people are unemployed (-594,000) -- this number was a little more than twice the number of people employed.
The denominator of the equation decreased.

Overall, not bad. Some of the decrease was actually do to people not being unemployed.

Expect more discussion about the labor force participation rate from this report -- which decreased to 64%. I've discussed this before, but it bears repeating; we're now in an age when baby boomers are retiring -- meaning this number will probably be lower for the foreseeable future (in fact, I would argue the shape of the labor force has fundamentally changed because of this).

Let's move onto the establishment data:


Employment in retail trade rose by 50,000 in November, with much of the increaseoccurring in clothing and clothing accessories stores (+27,000) and in electronicsand appliance stores (+5,000). Since reaching an employment trough in December 2009,retailers have added an average of 14,000 jobs per month.

Employment in leisure and hospitality continued to trend up in November (+22,000).Within the industry, food services and drinking places added 33,000 jobs. This gainmore than offset a loss of 12,000 jobs in the accommodation industry. In the last12 months, leisure and hospitality added 253,000 jobs, largely driven by employmentincreases in food services and drinking places.

Employment in professional and business services continued to trend up in November(+33,000). Modest job gains continued in temporary help services.Health care employment continued to rise in November (+17,000). Within the industry,hospitals added 9,000 jobs. Over the past 12 months, health care has added an averageof 27,000 jobs per month.

Manufacturing employment changed little over the month and has remained essentiallyunchanged since July. In November, fabricated metal products added 8,000 jobs, whileelectronic instruments lost 2,000 jobs.

Construction employment showed little movement in November. Employment in theindustry has shown little change, on net, since early 2010.

Government employment continued to trend down in November, with a decline in the U.S.Postal Service (-5,000). Employment in both state government and local government hasbeen trending down since the second half of 2008.
We see an overall improvement across the board in the establishment survey, with the exception of government employment.

On a scale of 1-10, I'd give this a 5.5.

-------------

NDD here with a few additional comments:

The best news is the continuing upward revisions of past reports. September and October were revised up a total of 72,000. For the last three months, the average gain was 143,000.

The more volatile household survey employment measure showed a gain of 278,000 in November on top of a gain of 277,000 in October. Since the household survey tends to lead at inflection points, these are very good numbers.

While the decline in the labor force will be trumpeted by bearish sites, this is responsible for only half of the .4 decline in the unemployment rate.

There were negatives, though. (1) Average hourly earnings actually decreased $.02. This is another reinforcing shot of real wage deflation. (2) The manufacturing workweek declined 2/10's of an hour. This is one of the 10 LEI, and is a significant negative although it just took back last month's gain. Over a longer period, this series is now trending sideways. (3) Only 2000 manufacturing jobs were added. This leading series is also trending sideways. (4) There was a slight decline in aggregate hours worked, although the longer trend remains strongly higher.

My bottom line is that the economy is once again showing strength - but this will once again trigger the Oil choke collar.

Morning Market


Looking at a chart of the SPYs, we see that prices have formed a symmetrical triangle.  However, while we see a technical compliance with this pattern, it's a moderately weak formation.  Notice that for a period of about two weeks, prices clung to the upper trend line.  Ideally, in a triangle formation, we'd like to see clean hits followed by a more away from the trend line.  And while we do see strong volume on the break-out move, the fundamental back-drop is less than encouraging.  I personally don't think there is any positive reason for the recent coordinated bank liquidity move.  In addition, the EU situation continues to hang on the precipice.  In short, I wouldn't be trading this as an upside break out just yet.  Prices would need to move through the 129 price level before I'd commit to the rally.

After breaking a strong upward trend, oil prices are now consolidating between the 96 and roughly 102.5 price level.  However, the overall trend is still strong -- all the EMAs are moving higher, prices are above the EMAs and the MACD is about to give a buy signal.  Fundamentally, we're not in the summer driving season and there is continued talk of an economic slowdown (some economists are now stating Europe is already in a recession).  That being the case, it's hard to see a strong rally emerging should prices move through the 102 area.


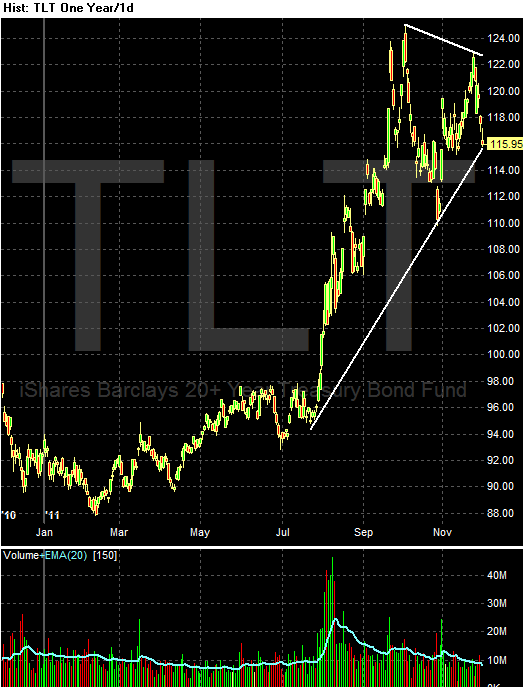
The longer (IEF) and long (TLT) end of the Treasury curve also appear to be consolidating. 

Merkel Nixes Eurobonds - Again!

Angela Merkel has again adamantly stated her opposition to Eurobonds as a means of saving the dying Euro experiment.

Quote: "Null and Void"

For good measure, Chancellor Merkel also gave a fulsome "Nein!" to the ECB acting as a lender of last resort.

She noted that the Euro crisis will take years to "sort out".

In terms of treaty adjustments and EU politics, she is correct. However, the Eurozone and global economy will not wait for years.

In the short term, whilst the politicians of Europe attempt to change treaties etc the markets need to be assuaged, otherwise the markets will tear the Eurozone apart.

Merkel and German politicians fret about "moral hazard". However, as I have stated on this site many times before, if your neighbour deliberate/carelessly sets fire to his house you help put the fire out first (lest it engulf your house as well) before you give him a kicking for being so careless.

Merkel et al need to bite the bullet and put a line under this issue now, with a major financial intervention by the ECB, new treaties in the coming years can address the issue of "moral hazard".


Thursday, December 1, 2011

Eurodoom

Yesterday, Matt Yglesias wrote a great column, that I believe explains part of the reason for the coordinated central bank action.  Read the whole thing, but here is the meat of his argument:


But a different kind of analysis suggests that the United States could face catastrophe if the Eurozone tanks.

This terrifying possibility is suggested in a Nov. 7 lecture by Princeton professor Hyun Song Shi, “Global Banking Glut and Loan Risk Premium” (PDF). The starting point for his analysis is the fact—well-known to financial practitioners, unknown to the public, and perennially rediscovered by the economics profession—that a very large share of the world’s dollars are held in non-American accounts. Indeed, for several years in the late aughts the total dollar assets of non-American banks actually exceeded the total assets of the U.S. commercial banking system and even today the ratio is close to 1:1.

These foreign dollars—mostly held by European-headquartered global conglomerates—are not isolated from the American economy. Just as U.S. firms and households deposit money in American banks and take loans from the banks, European global banks intermediate between savers and spenders of dollars. A 2010 Bank of International Settlements survey (PDF) revealed that as of 2009, 161 foreign banks were operating 226 branches in the United States that raised more than $1 trillion in wholesale funding, largely through money markets. Dollars raised in the United States tend to ultimately work their way back to the United States (which, after all, is where you can use dollars to buy things) through the shadow banking system. European banks aren’t the only ones in this game, but they are the largest player. The upshot is that decisions made in Europe about how much leverage to take on play almost as big a role in determining American credit conditions as do decisions made in the United States.

The lecture goes on to argue that European decision-making played a large role in inflating the now departed credit bubble of the mid-aughts, an interesting technical issue that needn’t keep you up late at night. The implication, however, is that a massive and sudden contraction of the European banking system would have the effect of automatically contracting credit conditions in the United States. If European credit markets tightened, the dollars held by European banks would suddenly become much less available as the basis for lending to American financial intermediaries and, ultimately, firms and households.

As George Mason University economist Tyler Cowen put it "if true, we are doomed."

It sounds counterintuitive to believe that less lending and less debt could be a problem when we’re currently suffering from the excessive borrowing of the past. But this hangover theory is mistaken. Less credit and less borrowing now will only make our problems worse. Some currently solvent enterprises and households will be pushed into bankruptcy by difficultly rolling over their current debt. Others will curtail purchases and investments. Both factors will reduce incomes and drive overall spending down, further adding to America’s already large stock of idle facilities and unemployed workers. The punch will come, in other words, not because the collapse of the European banking system will cripple the European economy and thus indirectly hurt our ability to sell things to Europeans. Instead the collapse of the European banking system will directly cripple an American economy that depends on European banks to provide a fair share of our credit. The middling growth of the past year has been powerfully driven by an incredible boom in equipment and software investment by American firms that could dry up overnight and deal a devastating blow to an already fragile economy.


Absent Without Leave

Nine crucial days to save the Euro. Emergency swap lines put in place overnight by the world’s top central banks. A new captain taking over a huge, recently-built ship in the middle of a raging storm. If there was ever a time when publicly-elected representatives should be grilling the head of the European Central Bank, this is it.

So when Mario Draghi arrived at the European Parliament Thursday, your correspondent was amazed to see the former Goldman Sachs executive playing to a virtually-deserted house. A rough leaning-over-the-balcony headcount gave 35 MEPs out of 736, as per the attached photo (Draghi is just to the right of the blue lectern in the centre, sitting in the front row).

Source The Wall Street Journal

Unleash the Floodgates of Money!!!!!!!

From Bloomberg:
Six central banks led by the Federal Reserve made it cheaper for banks to borrow dollars in emergencies in a global effort to ease Europe’s sovereign-debt crisis.

Stocks rallied worldwide, commodities surged and yields on most European debt fell on the show of force from central banks aimed at easing strains in financial markets. The cost for European banks to borrow dollars dropped from the highest in three years, tempering concerns about the euro’s worsening crisis after leaders said they’d failed to boost the region’s bailout fund as much as planned.

“It’s supportive but not necessarily a game changer,” said Michelle Girard, senior U.S. economist at RBS Securities Inc. in Stamford, Connecticut. “The impact is more psychological than anything else” as investors take heart from policy makers’ coordination, Girard said.

The premium banks pay to borrow dollars overnight from central banks will fall by half a percentage point to 50 basis points, the Fed said today in a statement in Washington. The so- called dollar swap lines will be extended by six months to Feb. 1, 2013. The Fed coordinated the move with the European Central Bank and the central banks of Canada, Switzerland, Japan and the U.K.
Why did this happen?
On Tuesday evening, Standard & Poor's downgraded the long-term debt ratings of some of the largest banks in the world.

By Wednesday morning, the Federal Reserve, the European Central Bank and central banks from
Canada, England, Japan and Switzerland announced coordinated action to support liquidity in financial markets that mirrors the 2008 financial crisis.

Once banks saw their ratings downgraded, it raised the specter that they would have to post billions in additional collateral on trades just as market pressures make it hard for them to replace the funds through a stock or bond offering.
There was a rumor that a European bank had nearly failed -- which is said to be untrue.
The Interwebs are all aflame with a rumor that a European bank was about to go kaput last night, which is what inspired central banks to turn up the liquidity spigots today.

Trouble is, there’s not an ounce of evidence this is true.

The rumor is based on a blog post written at Forbes by a nuclear physicist/hedge-fund manager that is pure speculation on his part: The only reason central banks would do this, he says, is if a bank was on the verge of failure.
 Regardless of the rumor mill, the impetus for this coordinated move -- whatever it was -- can't be good; central banks don't increase liquidity in a massive move unless there is something wrong somewhere.  Period.

The Threat from Europe

Sir Mervyn king, Governor of The Bank England, has spoken forthrightly this morning about the threat from Europe.

Using phrases such as:

- "Exceptionally perilous conditions";
- "Major solvency concerns";
- "Systemic crisis"

Clearly shows that he is very worried, and that the threat to the UK from the Eurozone crisis is worsening.

Sir Mervyn has called for UK banks to increase their capital reserves (via cutting dividends and bonuses, not cutting lending), not because they are under capitalised (they are better capitalised than European banks) but because it is "sensible and desirable to build resilience to threats to UK stability."

The "threat" of course comes from Europe.

How will this all end?

Here are six possible scenarios:

1 The Euro is devalued in order to keep all member states together and ease the pain on PIIGS.

2 PIIGS leave the Euro en masse, and in an "orderly" fashion. The Euro remains relatively stable as remaining countries in it are stable

3 PIIGS leave the Euro one by one in a disorderly fashion, as markets push Euro down and yields up.

4 Eurozone leaders create a "big bazooka" to deal with the short term confidence issue, and move towards full fiscal/political union in medium term (the Euro stabilises).

5 Eurozone leaders fail to create big bazooka but continue to work towards medium term fiscal union, markets tear Eurozone apart.

6 Germany leaves Eurozone and the remaining members devalue Euro.

To my view options 3, 5 or 6 are the most likely.

Share

Twitter Delicious Facebook Digg Stumbleupon Favorites More