logo

Thursday, December 2, 2010

Beige Book Shows A Decent Picture Of the Economy

Over the last week, I've looked at several major sectors of the U.S. economy (see here, here, here, and here). The purpose of this has been to demonstrate the economy is actually in better shape then previously thought. In addition, this week we've had some incredibly good numbers come out -- Chicago PMI printed some of its strongest numbers in over two years, auto sales were good, the ISM manufacturing numbers were good, and the ADP employment report was decent. The only bad news was the case shiller price index, which showed a decrease in home prices.

To sum it all up, here is the latest Beige Book from the Federal Reserve, which shows all of the above.

Reports from the twelve Federal Reserve Districts indicate that the economy continued to improve, on balance, during the reporting period from early/mid-October to mid-November. Economic activity in the Boston, Cleveland, Atlanta, Dallas, and San Francisco Districts increased at a slight to modest pace, while a somewhat stronger pace of economic activity was seen in New York, Richmond, Chicago, Minneapolis, and Kansas City. Philadelphia and St. Louis reported business conditions as mixed.

Manufacturing activity continued to expand in almost all Districts, with relatively strong growth seen in metal fabrication and the automotive industries. Reports also showed steady to increasing activity for professional and nonfinancial services. Two Districts noted a decline in demand from government agencies due to budgetary shortfalls. Reports on consumer spending tended to be positive. Nonetheless, several Districts noted that households remain price sensitive and focused on buying necessities. Expectations for the holiday shopping season were generally positive, with several Districts expecting higher sales when compared to year-ago levels. Sales of new cars and light trucks were largely higher than in our last report. Tourism improved in all reporting Districts.

Housing markets remain depressed, with several Districts reporting further weakening during the past six weeks. Conditions in commercial real estate were mixed, and activity stayed at low levels. Agricultural conditions were generally favorable, with several Districts reporting yields nearing historic highs. Agricultural sales to off-shore buyers increased. Overall activity in the energy sector continued to expand.

Lending activity remained stable across most Districts. Credit quality has been steady to improving for most of the Districts that commented on it. Prices for final goods and services were fairly stable, despite rising input costs, especially for agricultural commodities, metals, and fuel. Hiring activity showed some improvement across most Districts. Wage pressures were contained.


Here's the bottom line: the economy is in pretty decent shape right now. There are two problem areas: housing and jobs. Housing will be a problem child for some time because of excess supply, but there are signs the employment picture is getting better (making tomorrow's jobs report all that much more important).

And so, at long last, Daily Kos "economic analysis" goes completely insane

- by New Deal democrat

If you are not interested in left wing political blogs, or don't know anything about the blog Bonddad and I come from, or have no interest in Confirmation Bias, just pass on. This post shouldn't concern you. I promise that boring data analysis will resume shortly.
-----------
Watching an old friend or family member sink into alcoholism, psychosis. or some other self-destruction is sad, but at some point you half to accept that they are lost to insanity. Yesterday Daily Kos reached that point. The issue goes way past the issue of a blog post being right or wrong, but rather of economic blogging that isn't a laughingstock. Sadly, it is clear that the largest number of participants there have completely abandoned the ability or desire to think critically when it comes to the economy, and are so invested in bad news that any story, no matter how nonsensical, that fits into that narrative, will be showered with accolades.

At 2:17 am Pacific time yesterday, a writer posted an entry including the following lede:
... (you probably will start noticing it in the MSM soon, if not this morning), it appears that over the past 18 hours our country's largest bank, Bank of America, may have entered into the final stage(s) of a fairly swift implosion. Obviously, the economic, political and social implications of an event of this nature and magnitude occurring right now--if it does continue along its apparent trajectory even for a few more days--are nothing less than horrific.
....
Yesterday, MSM and blog stories started surfacing concerning two separate issues ... with either one providing more than sufficient cause to drive the two-trillion-dollar behemoth into receivership, or worse--that place where almost all divine oligarchic institutions have gone of late: taxpayer exponential bailout hell.
(my emphasis)

This is a major, breaking story of first magnitude if true. One of the country's largest banks is possibly going to be bankrupt within days, due - according to the writer - to a NJ lower court decision about foreclosures, or publication next year by Wikileaks of some internal emails.

The story swiftly became the top-ranked post on that site, and stayed there for hours. Hundreds of people recommended it and over 500 commented about it.

Not one of those hundreds of people questioned its premise.

Not for a full 9 hours and 11 minutes until a poster named Papicek who has occasionally commented here as well, put up the following:
DJIA is up 249.76 points today and I've yet to hear anything on this from CNBC. If BoA's in trouble and it hits the MSM, it'll hit the markets hard, unless BoA has one of those special lending facilities sweetheart lines of credit available from Treasury, the Fed and/or the FDIC.
So far, all I'm hearing is market rally cheerleading on CNBC.

BTW, Bob Pisani reports that the market buzz is that all the Bush tax cuts will be extended. So, it looks like the US Chamber of Commerce Brotherhood of Thieves and Pickpockets think they're going to get what they paid for from the GOP and corpradems.

BAC shares went up 0.34 today as well, as did all 30 Dow companies.
Another two hours passed, and then a poster named Escamillo said:
You guys should take advantage by shorting BoA stock. It's not just rich fat cats that are "investors", normal people are as well, and you can be too. And if you guys are so sure that BoA is going to tank, you'd be a bunch of saps not to take advantage.

To me, this diary smells like wishful thinking in the guise of objective analysis, but for those of you taking this diary as objective truth, you can make a huge killing.
I know that there are many people who read both that blog and this one. If you do, riddle me this:

If Bank of America is potentially within days of going bankrupt, and its stock going to zero, why are the following statements all true?

- that possibility was never mentioned on CNBC.

- it was never mentioned on Bloomberg

- it was never mentioned on CNN Money

- it was never mentioned on the Calculated Risk blog

- it was never mentioned on The Big Picture blog

- it was never mentioned at Seeking Alpha (investment site)

- it was never mentioned on Mish's blog (and Mish has been a Doomer for ages)

- it was never mentioned at The Automatic Earth (uber Doomers)

- it was never mentioned at Zero Hedge (specializing in short selling stories)

- it was never mentioned at Financial Armageddon (another Doomer site)

- not one short seller like Bill Fleckenstein wrote an article nor appeared on any financial channel to try to panic investors so that they could cash in their short positions for a hefty profit.

In short, why was the first - and only - person who broke this First Order Magnitude Story somebody who has no particular investing acumen, who has no financial position, who is not an economist or advisor, but rather an obscure public relations flak who apparently has a small credit-checking business on the side?

Because the story is ludicrous, that's why. The story was based on a major factual error by the writer. He relied upon this Business Insider story that said that BofA shares were down 1.7% on Tuesday, and misread it as 17%. With that mistake, he assumed BofA was beginning a death spiral. Even though ultimately his factual error was pointed out to him, all he did was delete the reference, but he did not change his story at all - even though its premise was completely undercut.

And so invested in any story of Doom were his hundreds of readers that it never dawned on them that the story might be wrong. They made it the number 1 story for hours on end at a supposedly "reality-based" site.

This isn't about whether the economy is "good" or not. It is close to the worst level in 70 years. This also isn't about whether the economy is "improving" or not, and for what percentages of people, although I think the evidence is that it is improving for most people who are employed. Further, I claim no special knowledge of BofA. Who knows what unknown events might lurk in the future.

No, this is about basic rationality. BofA isn't going bankrupt because of Wikileaks, nor because of some lower state court decision about foreclosure improprieties. And it is absolutely not going bankrupt in the next week.

It isn't the first time that writer has been wrong. It isn't even the 20th or 50th. In fact, it isn't even the first time his prediction of Doom due to a corporation going bankrupt has been wrong. Over a year in May 2009 he claimed that there were going to be
upcoming six-figure job losses certain to occur throughout the auto industry
due to the presumed liquidation and disappearance of both General Motors and Chrysler.

The long, long record of blown predictions by that writer isn't even the point any more. Rather, the slightest amount of critical analysis would have led one to the questions finally posed by Papicek a full 9 hours after the story was published. But no such critical analysis was to be found, and those who could provide it no longer will do so at that site.

At at some time you go beyond simply being wrong to being looney. Not just the writer, but all those who were so psychologically invested in bad news that they uncritically accepted and endorsed yesterday's lunacy, have reached that point.
U.S. Economic Status,Part IV: Employment

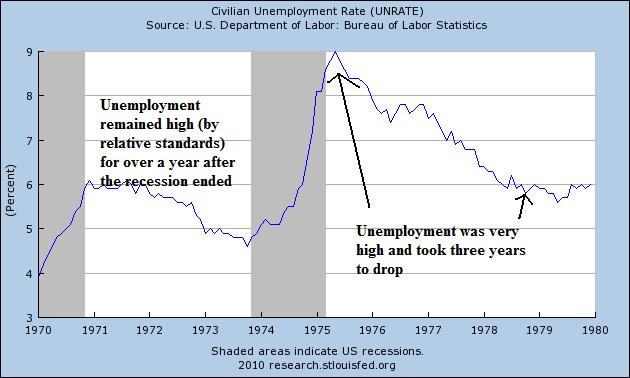
While the unemployment rate is concerning, it's important to note the current experience is hardly new; in fact, we've been here after each recession since the mid 1970s recession.


Note that after the mid-1970s recession, unemployment hit 9%. After four years it dropped to 6%, but never hit 5% -- the level most economists use to describe full employment.


After the second recession of the early 1980s, unemployment was nearly 11%. It took over 5 years to get back to "full employment."


After the early 1990s recession, unemployment rose to over 7.5%. Again, it took over five years to get back to full employment.


Although the unemployment rate increased after the early 2000s recession, it didn't hit very high levels. But like the last three recoveries, it took a long time (as in nearly four years) for the unemployment rate to drop.

This commonality with previous recoveries does not make the current situation any easier, and should not be used as justification for doing nothing. However, it is important to remember we've been here before.

Initial unemployment claims have remained at a stubbornly annoying high level for the better part of the year. However, this is not the first time we have seen this behavior from initial claims.


Notice in the above graph of initial claims there have been two different types of "recoveries" in initial unemployment claims; fast recoveries that occurred before the early 1990s expansion, and slow recoveries that occurred in the last three expansions. This is one of the primary reasons the last three expansions have been labeled "jobless" recoveries. I explained the reasons for this development of "jobless recoveries" in two posts, located here and here. NDD offered a rebuttal here.


Taking a closer look at the early 1990s expansion, notice the initial unemployment claims remained elevated for about a year and a half after the recession ended.


The same is true for the early 2000s recovery -- initial unemployment claims remained high for about a year and a half after the recession ended.


Notice that with this recovery, we are experiencing the same developments.

In short, it appears that while concerning, initial unemployment claims are behaving much as they have in the last two recoveries. This leads to a question regarding the definition of recovery -- that is, can you have a recovery without a drop in initial unemployment claims below a level of say, 400,000?


Yesterday's Market


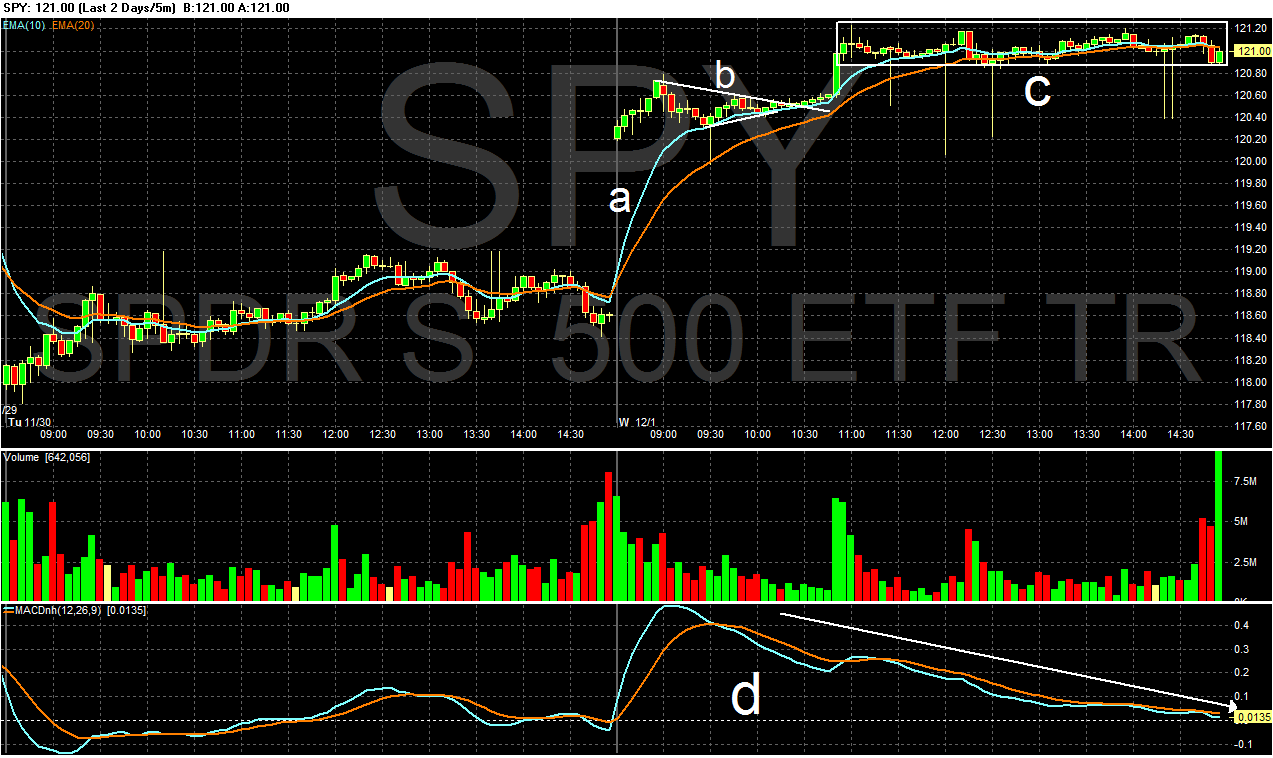
Yesterday, prices gapped higher at the open (a) and then formed two consolidation patterns for the rest of the day; a triangle in the AM (b) and a rectangle in the PM (c). Also note the MACD (d) which jumped on the gap higher but then moved lower for the rest of the trading day. This is a standard pattern for a consolidation day.


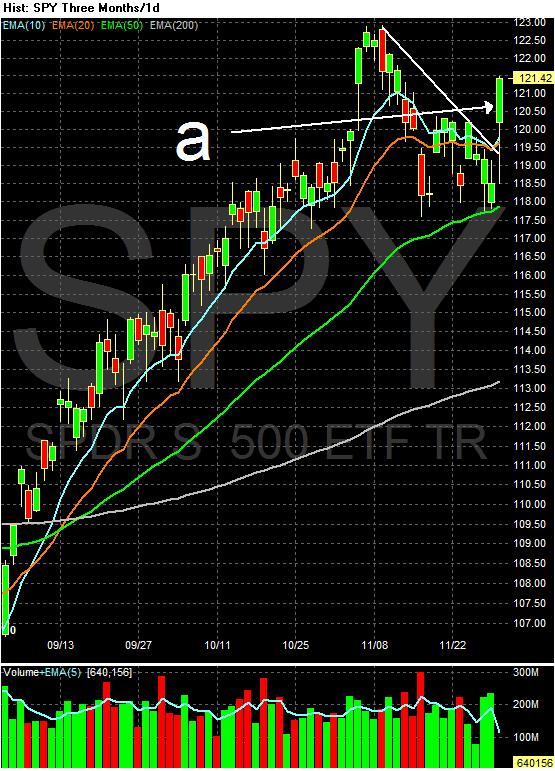
On the daily chart, notice that prices moved through key resistance yesterday.


The Treasury market was a mirror image of the equity market. Prices gapped lower at the open (a), and then rose a bit during the AM. However, as soon as prices hit the 10 and 20 day EMA they started to move lower (c), and did so for the rest of the day. Also notice the MACD (d) was rising for most of the day.


Treasury prices continue lower (a). Also note the EMA picture; the shorter are below the longer, all EMAs are moving lower and prices are below the EMAs (b).

Notice that equities are rising and bonds are falling. This is indicative of a bull market, as money leaves the bond market (which is considered safer) and moves into equities (which is considered riskier).


While the dollar has recently enjoyed a strong rally (a), notice it has hit resistance at the 200 day EMA (b).

A "Series of Bad Decisions"

The FSA has announced that it will not take any enforcement action against the ex CEO of RBS, Fred "The Shred" Goodwin; the FSA has now closed its 18-month probe into the conduct of RBS executives, the acquisition of ABN Amro in 2007 and a 2008 rights offering.

The Telegraph quotes the FSA:

"The review confirmed that RBS made a series of bad decisions in the years immediately before the financial crisis, most significantly the acquisition of ABN AMRO.

The review concluded that these bad decisions were not the result of a lack of integrity by any individual and we did not identify any instances of fraud or dishonest activity.

The competence of RBS individuals can, and will, be taken into account in any future applications made by them to work at FSA regulated firms.
."

The last sentence is the FSA's attempt to add "stones" to their statement of the "bleedin' obvious", namely that "a series of bad decisions" had been made.

The FSA won't disclose details of its investigation, they expect people to blithely accept their opinion and move on.

Not really very much to show for 18 months of "investigation"!

Did not our government, during the run up to the election, say that they were going to shut down the FSA?

Wednesday, December 1, 2010

Mini-May? LIBOR is awakening

- by New Deal democrat

In the past I identified 7 harbingers of the sudden downdraft in the economy that took place over the late spring and summer. With the renewed Euro crisis, other commentators, notably Prof. James Hamilton of Econbrowswer have picked up on the resemblences of the current situation to then (and with Calculated Risk reposting Hamilton's work, you should expect that the resemblences are at this point becoming widely known).

A few weeks ago, I updated the 7 harbingers and concluded they were not suggeting another downdraft at that point. There has been at least one important change, so let's update again.

Harbingers which have turned down:

Shanghai stock index - after a 10% crash in 2 days this market has moved sideways. In April-May it plummeted about twice as much.

Oil prices at 4% of GDP - Oil came very close to $90 again at the beginning of November but already backed off. The duration of the upward move was shorter, and unlike April, there were no intraday moves over $90. Here's a graph:


Libor index rising - this is probably the most telling harbinger of all.

Here's what I said a few weeks ago: "Not only is it still asleep, it has actually declined in the last couple of weeks. There is ZERO anticipation of banking stress evident."

This has changed. LIBOR is awakening from its slumber:


While the percentage move is small at this point, fear is again being introduced into the banking system. Since the European monetary and political leaders appear hapless at this point, unless there is a sudden introduction of shrewdness, I would expect LIBOR to continue to rise. This is the only way I see that the Euro crisis affects the US economy at this point.

Harbingers that have not confirmed a slowdown:

Bond yields correlation with stock prices - This one is a close call. For the last two months, these have both moved up, but on a daily basis these continue to move as mirror images and not in tandem, indicating no fear of a deflationary pulse:


Real M1 and M2 money supply stagnant or shrinking - to the contrary, both continued to grow in November

Price growth exceeded wage growth - Unlike springtime, wage growth now, albeit poor as measured by median compensation, is still running ahead of inflation. Measured by personal income, it is well ahead of inflation.

Decline in housing permits and purchase mortgage applications - purchase mortgage applications are trending sideways and permits are due out tomorrow. They are also expected to trend sideways.

One more thing: The more I have thought about it since summer, the more I believe the BP oil catastrophe in the Gulf of Mexico had an outsized effect on US consumer and employer psychology. Day after day, live video from the bottom of the Gulf showed an ongoing cataclysm, with US authorities looking helpless and ineffectual. G*d willing, we will not see any similar disastrous event unfold now.

In Conclusion, three of our harbingers show increased risk. Of these, the Shanghai index shows only half of the decline as in spring, and Oil did not go as high, or stay there as long, as in April.

The other 4 harbingers do not show increased stress, in fact they are positive for the economy. Also, there is no focusing disaster to trigger the response of Pavlovian fear of another September 2008 style meltdown that I believe was instrumental in the summer slowdown.

My view at this point: it's Mini-May.


On the Deficit Commission

SilverOz here.

The Deficit Commission released it's report today and I for one like most of it. Obviously, any cutting of the deficit and reigning in the growth of federal debt is not going to please everyone and there are several things in this report that I would do differently, but then I am not on the Commission. For this post though, I would like to concentrate on the tax changes recommended (specifically the "illustrative proposal").

The Commission proposes essentially ending all tax expenditures (what we know as deductions, credits, and subsidies) and then using the bulk of that savings to consolidate the tax code into three brackets and lower overall rates. What they don't tell us is where each of these brackets begins and ends (at least not where I could find in the report), which while interesting, doesn't impact the discussion since they do provide some breakdown of the impact on various income quintiles. Essentially what the commission is doing is making the effective tax rates the actual tax rates, which will make the code more fair at any given income point (but depending on ones opinion, not necessarily fair across different incomes (ie rich and poor)). Under the current code, two people making the exact same income living in the same city (and even neighborhood) can end up paying widely different amounts in taxes depending on all the various deductions and credits. And while these changes may not be good news for accountants, the simplification of the tax code would save money and time in its own right.

Under the Commission's illustrative proposal, they would eliminate all tax expenditures except for the earned income tax credit (EITC) and child tax credit, change the mortgage interest deduction into a non-refundable credit capped at a $500,000 mortgage, eliminate the tax-exempt status of new muni bonds, and tax all cap gains and dividends as ordinary income (among other things). These changes would then allow for brackets of 12%, 22%, and 28% (all with a standard deduction). The lower brackets would actually increase revenue generated (somewhat) by not utilizing all of the savings from the elimination of tax expenditures for the lower brackets, which allows some to be used to offset the deficit (ie the proposal does raise some taxes somewhere between $80-180 billion).

The change in tax liability by quintile goes up for each, but is definitely skewed towards the highest earners, with the top quintile losing about 3.7% in after tax income (the 3 middle quintiles are around a 1.5% loss and the bottom quintile a .4% loss), but with the top 1% seeing a loss of almost 8% and top .1% seeing a loss of almost 12% (so the tax code retains its progressive nature). What this means is that while everyone is going to see a tax hike, the biggest hikes in terms of percentage of income are skewed toward the wealthiest of Americans as opposed to the middle class.

Finally, I want to comment on the proposed elimination of the mortgage interest tax deduction, as that is an issue that both the left and right (well, the homeowning left and right) seem to get riled up about (full disclosure: I am a homeowner who takes advantage of the deduction). First, it is one of the biggest tax expenditures in the tax code (approximately $100 billion/year) and thus has to be addressed under any real reform. Second, the deduction rewards bad financial behavior, as it rewards those who either a) put down less than 20%, b) buy more house than they should afford (remember the housing bubble), or c) those with bad credit (who get higher interest rates). Also, the deduction is geographically skewed, as more of it's benefits are going to go to say the coasts and other high value areas over the midwest. Finally, the deduction is really nothing more than a reward for taking on debt, something that in light of the recent recession maybe we shouldn't be encouraging anymore (it doesn't reward home ownership, as the cash buyer gets nothing out of it except a higher price to buy at).

In conclusion, I actually like the bulk of the Commission's report and would love to see a bipartisan approach (like this one) on the deficit/debt issue. As a realist however, I know that this report has zero chance of passing and real efforts to reduce our deficit/debt will only come when forced (see Greece).

U.S. Economic Status, Part III: Investment


Let's start with the macro picture of investment, which has been steadily increasing for the last five quarters.


Private non-residential investment has increased the last three quarters, indicating that business is investing in some real estate development.


However, it's the equipment and software investment that is the real reason for the increase. Notice the size of the quarter to quarter increases for the last three quarters.


Residential investment is still low, and will probably be that way for some time.


Inventories are being restocked; this overall number has been increasing solidly since the end of 2009.


However, the inventory to sales ratio is about halfway between 1.25 and 1.30, which is about halfway between the high and the low from the last expansion. Also note this number has been decreasing since the early 1990s. So, for inventories to continue their contribution to the expansion, we need to see sales increase

Yesterday's Market


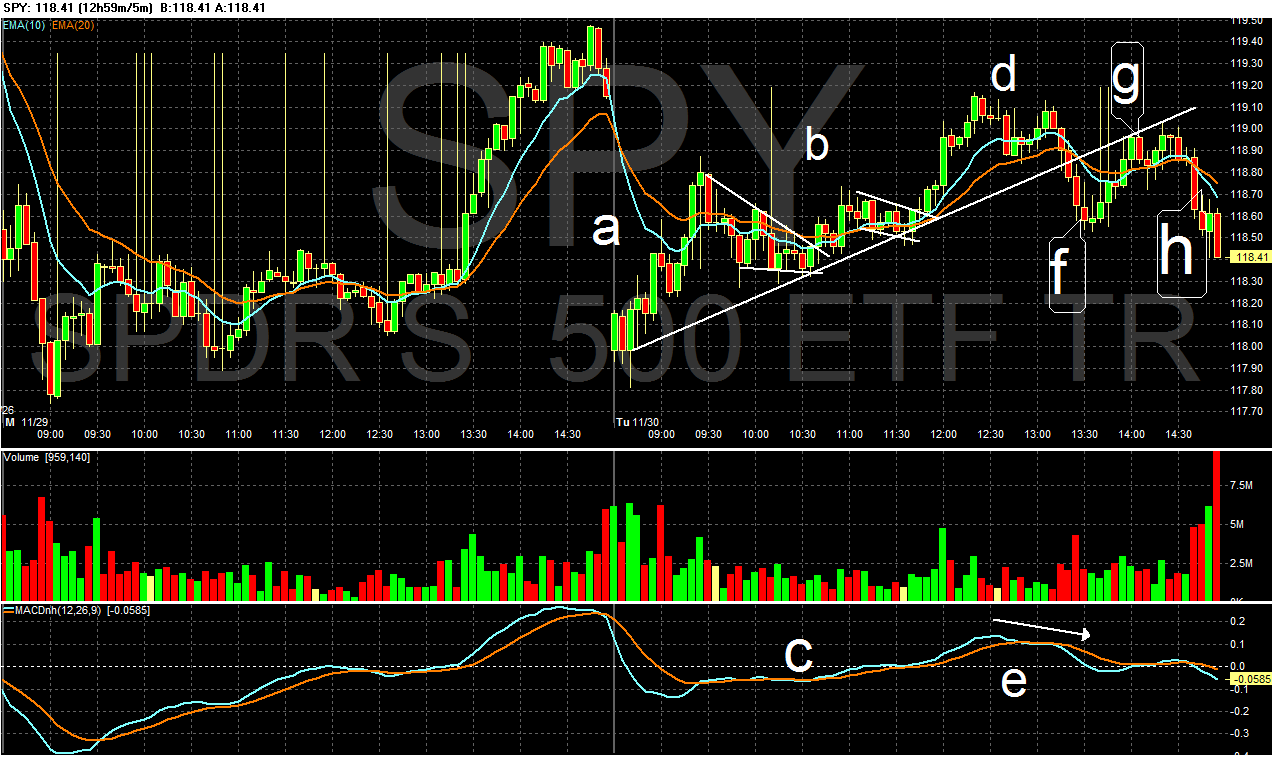
Yesterday prices gapped lower at the open (a), but then started to move higher but very slowly. Notice the MACD at (c); there is very little movement, indicating the trend is very timid. Along the way we had several consolidation areas (b). At (d) there is a double top with declining momentum (e), indicating a possible change of direction, which occurred at (f). Prices rallied into the close (g), but then sold-off (h) on high volume.


First, notice that prices yesterday ran into resistance from a price level established a few days ago.


Treasury prices gapped higher at the open (a), but hit resistance at the above mentioned price point (b). Also note that momentum started to drop (c) around this time, indicating a possible change in direction was coming. After being unable to break through resistance, prices formed a downward sloping channel, bound by lines (d) and (e).


The dollar continues to move higher (e) with several gaps indicating a supply/demand imbalance. However, yesterday prices broke through the trend line (f), albeit barely. This leads to the question -- how much of a trend line break is necessary for the break to matter? Martin Pring uses the 3% rule -- a 3% break is required for the break to be valid. I'm not so rigid in my analysis. The answer is it depends. Considering the strength of the uptrend, I don't think yesterday's break was important. However, today's action will be the primary determinant.


Copper has broken is primary uptrend (A). However, prices found support at the 50 day EMA (B). Notice the EMA picture shows the 10 and 20 day EMA moved lower, but not in a big way; in addition, the shorter EMAs are above the 50 day EMA. The MACD is still positive and is about to give a buy signal. However, lurking over the technical picture is China, which has printed increasing inflation numbers, indicating they will probably be tightening their lending policies soon.

Mervyn King Under Pressure

Mervyn King, Governor of The Bank of England, is the latest prominent figure to be embarrassed by the Wikileaks saga.

A cable sent by Louis Susman (US Ambassador) to Hillary Clinton in February 2010 summarises Mr King's views about David Cameron and George Osborne, expressed during meeting that he held with the ambassador.

The Governor opined that Cameron and Osborne "had a tendency to think about issues only in terms of politics, and how they might affect Tory electorability", and was worried about their lack of experience.

There are some who are now calling for King's resignation, citing his alleged "thirst for power". Quite why a private conversation with the US ambassador, albeit embarrassing now that it is leaked, should force him to resign is beyond me.

I suspect those who are making this call are doing so based on their personal dislike of the man, rather than on any specific "offence" and alleged "breach of neutrality" that they claim that he has made.

Share

Twitter Delicious Facebook Digg Stumbleupon Favorites More