logo

Tuesday, October 5, 2010

Prison Work Proposal

Ken Clarke's proposal to make all prisoners work a 40 hour week, and for them to be paid a minimum wage, is a good idea:

- It will alleviate the soul crushing boredom of prison, a recipe for trouble in any institution.

- It will give the prisoners some self respect.

- It will give the prisoners experience of real work, something many of them may never have had.

The downside of this proposal is that for the honest law abiding long term unemployed, it may come across as a bit of a "slap in the face".

Monday, October 4, 2010

Don't Forget About India

Remember the BRIC economies -- the four foreign economies that will help to drive the next century's overall world growth -- includes India. The Economist has a story in their latest magazine on the country that is very interesting:

India’s GDP is expected to grow by 8.5% this year, and could grow even faster. Chetan Ahya and Tanvee Gupta of Morgan Stanley, an investment bank, predict that India’s growth will start to outpace China’s within three to five years. China will rumble along at 8% rather than double digits; India will rack up successive years of 9-10%. For the next 20-25 years, India will grow faster than any other large country, they expect. Other long-range forecasters paint a similar picture.

India’s GDP is expected to grow by 8.5% this year, and could grow even faster. Chetan Ahya and Tanvee Gupta of Morgan Stanley, an investment bank, predict that India’s growth will start to outpace China’s within three to five years. China will rumble along at 8% rather than double digits; India will rack up successive years of 9-10%. For the next 20-25 years, India will grow faster than any other large country, they expect. Other long-range forecasters paint a similar picture.

Several factors weigh in India’s favour. The first is demography. Indians are young (see chart 1). “An ageing world needs workers; a young country has workers,” says Mr Nilekani. Previous Asian booms have been powered by a surge in the working-age population. Now it is India’s turn. The proportion of Indians aged under 15 or over 64 has declined from 69% in 1995 to 56% this year, says the UN. India’s working-age population will increase by 136m by 2020; China’s will grow by a mere 23m, says Morgan Stanley (see chart 2).

.....

India’s second advantage is that the economic reforms of the early 1990s have unleashed an explosion of pent-up commercial energy. Tariff ramparts have been torn down (see chart 3). The “licence raj”—a system under which it seemed that a businessman could not pick his teeth without a permit—has been swept aside. Private firms have been forced to compete with the world’s best. Many have discovered that they can. Exports have shot up.


Where Will Growth Come From?, Part I: PCEs

This week, I'm going to take an in-depth look at the four components of GDP: personal consumption expenditures (PCEs), investment, exports and government spending to see how each may or may not contribute to economic growth over the next few quarters. Let's start with PCEs.

Above is a chart of PCEs percentage change from the previous month. Notice that PCEs have increased for the last four months and in 9 of the last 12 months. Let's break that number down into its smaller components (for more information on what we spend our money on, go to this link).


Service expenditures account for 65% of PCEs. On a month to month basis, this part of PCEs has been increasing at a small but consistent rate.


Non-durable goods -- which account for 22% of PCEs -- were weak for a period of four months, but grew strongly in the period before and after that weak patch.


Durable goods purchases have also been weak.


Above is a rate of the percentage change in PCEs at an annually compounded rate. PCEs are increasing at about 2%/quarter at an annual rate. While this is a lower compounded annual rate than previous expansions, it is still growth.

So, the consumer has been spending, but not at a robust pace. There are several reasons for the slower pace of PCE growth. The most obvious and perhaps most important is the high unemployment rate, which obviously lowers consumer confidence. Here is a chart of the University of Michigan's consumer sentiment:


First, notice the total index (the blue line) has been printing continually lower numbers for the last two expansions. This indicates consumers have been growing more and more concerned over the last decade; it's not a new phenomena. Secondly, notice this expansion is also printing lower numbers overall compared to the last two numbers. So, despite four quarters of growth, overall sentiment is mired in a lower range than previous expansions.

Also hurting sentiment is the housing market, which is still correcting and will probably be doing so far at least another year. The primary issue is a massive inventory overhang in relation to overall demand. Until this inventory is cleared, expect housing to be an issue.

Finally, there is the issue of household debt. According to the latest Flow of Funds report, total household debt outstanding is $13.4 trillion. Total consumer credit outstanding has been decreasing for the last 9 quarters, indicating consumers are moving away from debt.

In addition, the savings rate is increasing, indicating consumers are shunning away from consumption and moving towards saving money for a "rainy."


However, pay is also increasing modestly, providing consumers with new funds. First, here is a chart from the Kansas City Fed:


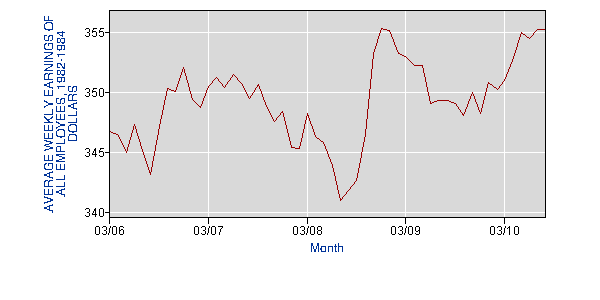
Notice that average hourly earnings are edging higher even though weekly hours have been moving sideways. Here is a chart of average weekly earnings in 1982/1984 dollars from the BLS:

The number was stagnant for most of last year, but rose strongly during the first half of 2010 year before plateauing over the last few months. In addition, here is a chart of the month to month percentage increase in disposable personal income:


So, there is some new money entering the economy, meaning consumers have the money to make new purchases. However, it appears they are dividing their "expenditures" between savings, paying down debt and PCEs.

So long as the employment situation remains the same -- that is, high unemployment and weak job growth -- there is little reason to think consumers will change their current behavior of slower spending growth, increased savings and paying down debt.

Yesterday's Market

The primary battle lines in the market are between equities and bonds. There has been a big flow of money into bonds of all types -- Treasuries, high grade corporates and junk. This inflow has kept money out of the equity markets. The yields on Treasuries are getting very low -- the 10 -year is currently yielding 2.62%. While the 10-year could technically go to 0% that is not going to happen. The reality is at some level investors are not being compensated for the risk they are undertaking. But until we get to that point, we're looking at bonds and stocks battling it out.


The SPYs are just above key resistance. BUT


Last week they traded in a very tight range just above resistance; upward momentum dropped. In addition,


The Russell 2000 is just above key resistance, and


The DIAs (the Dow) is just under key resistance.

In addition, consider this chart of the overall dollar index:


The index has formed a head and shoulders pattern for most of the year. Now that prices have fallen through resistance,


We're seeing a big drop in the dollar. Prices are clearly in a downtrend (a) and have printed several gaps down over the last month (b). As such, expect commodities to have an upward bias.

Child Benefit Shake Up

I see that George Osborne used the BBC Breakfast show to announce to a bleary eyed "Monday morningish" nation that child benefit for higher rate taxpayers would be axed "by" 2013.

Someone should remind Osborne that announcements such as this should be made to Parliament first. The Tories were always quick to criticise Labour when they indulged in this form of "government via media announcement", sadly they seem to be emulating their foe.

Credit to the interviewer, who was clearly taken by surprise, for trying to press some details out of Osborne. She quite rightly made him admit that "higher rate" includes not just those on 50%, but also those on 40%.

She then asked, in relation to "by 2013", whether this would be phased in over a period of time up to 2013. Osborne gave a rambling, evasive response which did not answer the question.

Quite clearly he intends to start cutting child benefit back (for higher rate taxpayers) now, in phases, rather than leaving it all until 2013.

Friday, October 1, 2010

Weekly Indicators: September was not the cruelest month Edition

- by New Deal democrat

This was a slow news week for monthly statistics. Personal income and spending both came in very well at +0.4% and +0.5% respectively, so "real" PCE's were up +0.2%. Construction spending also somewhat unexpectedly improved, although nonresidential declined -1.4% so as expected no bottom there yet (but the rate of decline is decreasing). The Chicago PMI showed a return to strong manufacturing, but regional Federal Reserve reports were mixed and generally weak, as was the ISM Manufacturing Index. The ISM employment index also declined, but not enough to signal actual job contraction. Second quarter GDP was revised very slightly higher to 1.7%. Household debt as a percentage of disposable income continued to plummet during the spring as well. Consumer confidence was awful as measured by the Conference Board, and merely very bad as measured by the University of Michigan. [UPDATE: September auto sales, at 11.76 million annualized units, were the highest all year - just slightly.]

On the other hand, we already know enough to estimate that September's Leading Indicators will almost certainly be positive. The yield curve remains positive. Initial jobless claims declined strongly from August. Money supply has increased significantly so far from last month. The stock market rallied all during the month and is at a three month high. Housing permits for August rose slightly. Orders for core capital durable goods were up strongly as well. So far, only the U Michigan consumer expectations decline and the significant ISM vendor deliveries decline are negative (the latter strongly so). Unless hours worked in manufacturing collapses in the jobs report a week from today, we are very likely to have a significantly positive LEI for September.

High frequency weekly indicators have also run well all month, and continued this week.

The Mortgage Bankers' Association reported that its Refinance Index decreased 1.6% from the previous week, and has now declined for 4 straight weeks, although demand is strong compared with the last year in general due to very low rates. The seasonally adjusted Purchase Index increased 2.4% from one week before. Purchase mortgage activity continues to remain significantly above its July lows, but the bounce is insignificant compared to declines since one year ago..

The ICSC reported same store sales for the week ending September 26 increased 0.4% week over week, and up 3.6% YoY, for the second week returning to its strong YoY performance of several months ago. Shoppertrak also reported that for the week ending September 25, YoY sales rose 2.1%.

Gas prices declined 3 cents to $2.69 a gallon, and at usage at 9.383 million gallons was /250 ahead of last year at this time. Gasoline stocks continue to be 10% above their normal range for this time of year.

The BLS reported 453,000 new jobless claims. The four week average declined to 459,000, near the bottom of its range for this year.

Railfax showed rail traffic improving again last week, and improving at a rate similar to one year ago. The only weak spot is that economically sensitive waste and scrap metal continue to run at or below last year's levels, and autos loads are weak as well.

The American Staffing Association reported that for the week ending September 19, temporary and contract employment increased to 98.0, the highest reading in over two years.

M1 remained flat last week, but increased about 2.5% month over month, and up 6.5% YoY, so “real M1” is up 5.3%. M2 increased again very slightly in the last week, +0.7% month over month, and up 3.0% YoY, so “real M2” is up 1.8%. The ultimate story remains the same: Real M1 still strongly indicates no double-dip recession, and real M2 has been generally improving in the last few months, but is still under 2.5% YoY which would get us into the green zone.

Weekly BAA commercial bond rates declined last week, down .07% to 5.66%. That rates fell while stocks rose is a good sign. the DJ Bond Average also made a new high last week. This is inconsistent with economic contraction.

Twenty days into September, the Daily Treasury Statement is up $128.1 B vs. $117.6 B a year ago, a gain of ~8.8%. September's withholding tax receipts have consistently been among the best readings in the last 6 months.

The weekly indicators have now put in a solid 4 weeks of positive readings. The only fly in the ointment is the significant decline in manufacturing growth. It seems that vendors are very leery of being caught with excess inventory, and are trimming back orders accordingly. Nevertheless, that only signifies a slowdown in manufacturing growth, not any outright double dip.

Is the Threat of Deflation Past?

Consider the following headlines from today's Bloomberg:

Copper Climbs to Two-Year High on Chinese Manufacturing, Weakening Dollar

Gold Advances to a Record as Slumping Dollar Spurs Demand From Investors

Cocoa Rises to Six-Week High in New York on Ecuador Clash; Sugar Declines

Rubber Climbs to Five-Month High as China's Manufacturing Growth Quickens

The gold headline is particularly interesting as it is often used a a hedge against inflation. Now, part of the recent rise is the "uncertainty" trade (or maybe I should call it the Glen Beck trade). However, gold is considered a fundamental store of value and inflation hedge as well.

Let's take a look at the data:


PPI for crude goods printed a series of negative month to month decreases earlier this year. But, the last two months have seen some large increases.


Intermediate goods saw two months of negative numbers, but printed an increase last month.


Overall PPI has printed some low month to month increases the last 5 months, with one month printed a negative number.


CPI printed some very low numbers (and even went negative) for most of 2010. But the number has printed strong increases the last two months.

I don't think we're out of the woods yet. But the last few months of PPI and CPI data are very encouraging. In addition, we continue to see commodities increase. Finally, with the dollar moving lower, further commodity increases (or at least price stagnation at current levels) is high. Short version: another few months like this and we will be out of the woods.

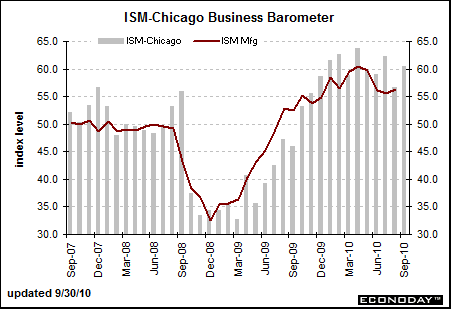
Chicago PMI Up


From Marketwatch:

A Chicago-area economic report issued Thursday showed unexpected strength in September, giving further ammunition to the camp optimistic about prospects for the U.S. economy a day ahead of a national manufacturing report.

The group’s measures of orders and production rose above their six-month averages, indicating corporate investment in new equipment will remain a source of strength for the economy.

“After a soft patch, manufacturing is in a process of mustering some activity,” said Ward McCarthy, chief financial economist at Jefferies & Co. in New York. “It seems to be moving in the right direction again and that will help the economy continue to grow.” McCarthy forecast the Chicago index would rise to 58.

Automakers including Dearborn, Michigan-based Ford Motor Co. are among manufacturers seeing sales picking up while holding below pre-recession levels.

“The auto business is pretty steady and coming back up a little bit,” Ford Chief Executive Officer Alan Mulally told reporters in Ann Arbor, Michigan, on Sept. 17. The economy “is coming back slower than past recessions.”

Let's take a look at the data


The index made a nice jump compared to its previous reading. However, note that an expansion occurs on a reading above 50 where the index has been for some time.

The above graphic shows the jumps in both production and new orders.


The anecdotal information was very interesting; mixing some very good statements (staff is so thin that a problem could develop due to too few employees) to concerning statements (increases in mortgage walkaways). Also note two statements about price increases indicating that the increase in commodities is starting to pass through to consumers.

The "Luck" of The Irish

Commiserations to the people and government of Irleand who, having come to the rescue of their beleaguered banks during the global credit crisis, now have to do it again.

The Irish government will now take control of Allied Irish Banks Plc, and inject extra cash into the previously nationalised Anglo Irish Bank Corp. The cost of the rescue is estimated to be around Euro50BN.

The Irish budget deficit will be approximately 32% of GDP. In order to try to avoid following Greece, and having to ask for an EU/IMF bailout, the government will be making further cuts in its budget.

As to whether this is politically acceptable remains to be seen.

Yesterday's Market


Let's start with the Treasury market. Notice that prices are still right below the long-term trend line. But it's not just the Treasury market that is absorbing would-be equity investors.


The lnvestment grade corporate bond market is also in a strong rally (note the classic advance (a), sell-off (b) advance (c) structure), as is


the junk bond market. Notice that prices have moved in an advance (a) with downward sloping consolidation channels, with a sell-off (b) and a further advance.


The SPYs have gotten right above key resistance levels (a), but notice the rally has stalled at least for now.


The DIAs are right at important resistance (a) and have been there all week.


The IWMs -- like the SPYs -- have advanced beyond important resistance, but just barely.


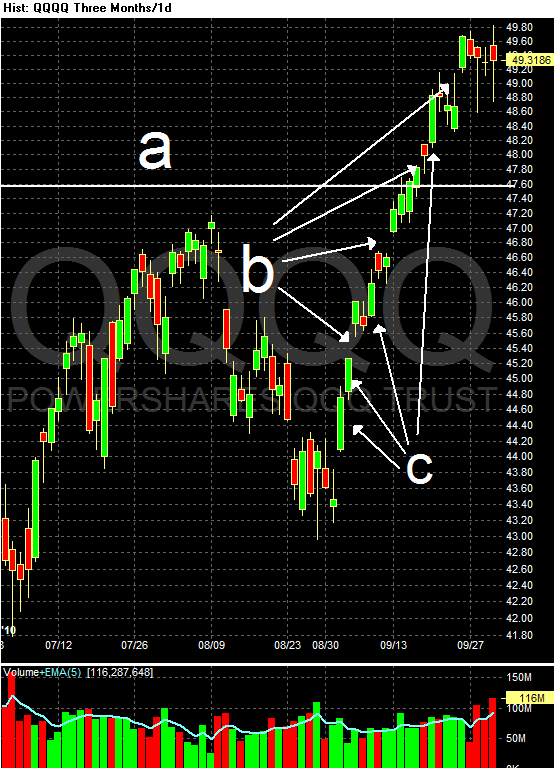
the one exception has been the NASDAq, which has had a strong advance. Prices are above key resistance levels (a) and during the rally we've seen some strong bars (c) and several gaps higher (b). But the advance hasn't translated to other markets.

My guess is the flow into fixed income is taking money away from the stocks market right now.


Although still in a trading range, oil has recently advanced through resistance (A), printing some very strong bars (B). Now prices are above resistance (C), and momentum has given a buy signal. But note that oil stocks are still incredibly high and will probably act as a damper on strong upward movement.


After a strong rally in reaction to the Russian wheat embargo, wheat is now selling off (A) and is now below the 50 day EMA (B). Also note the MACD is giving a strong sell-signal.

Share

Twitter Delicious Facebook Digg Stumbleupon Favorites More