logo

Showing posts with label unemployment rate. Show all posts

Friday, February 24, 2012

Prepare for less than 8% unemployment

- by New Deal democrat

As I've pointed out a number of times, the initial jobless claims rate, i.e., the percentage of the population filing for first time unemployment, has for 50 years (as long as the statistic has been reported) had a leading, and a tightly fitting relationship to the unemployment rate.

Here's how these two statistics stand as of yesterday's initial claims report:


[Note: since the population series hasn't been updated since December, but has been growing by just under 200,000 a month, I added 300,000 to average January and February and then divided the most recent weekly claims by that number, in green].

Since the initial jobless claims rate tends to lead the unemployment rate by about 3 months, we should see unemployment at under 8% by no later than the May payrolls report. I anticipate at least another 0.1% decline in the unemployment rate, to 8.2%, to be reported next week.

Further, as I said yesterday, if the relationship between initial claims and payrolls in this recovery holds (a 27,500 gain in monthly payrolls for every 10,000 decline in the monthly average of initial claims), I expect February payrolls to be somewhere in the vicinity of +290,000, although there is enormous variability (+/-75,000) around the trend.

Thursday, January 19, 2012

1952: Employment and Income

1952 continued the strong employment situation started in 1951:


The unemployment rate -- which was already low -- continued at it's strong rate, fluctuating between 3.4% and 2.7% for the year.  


 Total employees on all payrolls was more or less constant for the first seven months of the year, but really started to take-off in the last five months.


 Goods producing industries were pretty constant for the the first five months of the year.  They dropped over the summer, but then really took off. adding over 600,000 jobs in the last five months of the year.


Service producing industries saw better overall performance; they increased a bit during the first few months, leveled off, and then increased strongly in the last five months of the year.  Overall, we see services adding a little under 1 million jobs for the year.


Growth in government employment mirrors the service industry chart for the year.

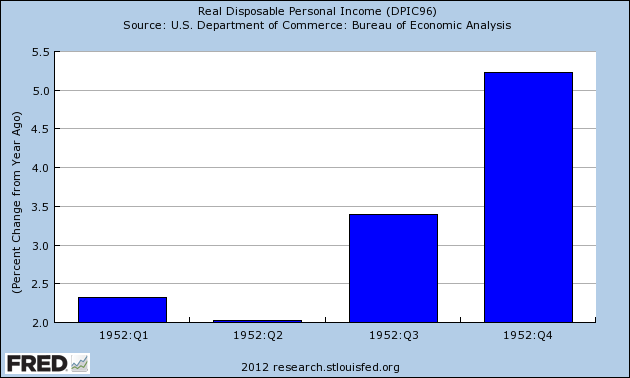
Thanks to a low rate of unemployment, we see strong growth in DPI:


 Total DPI increased every quarter in absolute (inflation-adjusted) terms.


 The continuously compounded annual rate of change was weak in the first quarter, but picked-up momentum in the second and third quarter, and ended the year on a strong note.


The rate of change year over year was small in the first half of the year, but accelerated in the second.


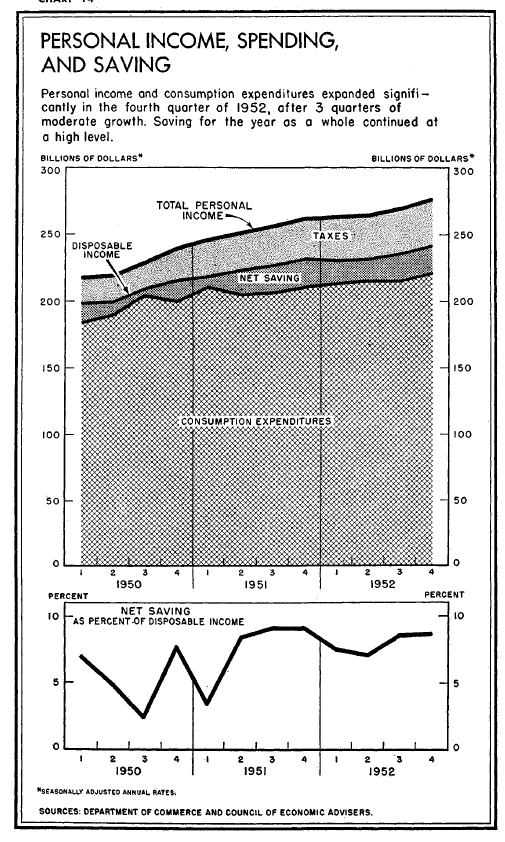
Finally, above is a chart from the 1953 Economic Report to the President that shows income and savings -- which was at a very strong rate in 1952.


Monday, December 5, 2011

Notes on Friday's employment report: positive trends intact, actual good news in household survey

- by New Deal democrat

Friday's employment report continued the trends of employment as continued to initial jobless claims that were established in March 2009.

First of all, here is the updated graph comparing population-adjusted initial jobless claims with payrolls:


This relationship was historically very close beginning in 1967 but broke down in 2009. For the last two years, however, the new relationship established then has continued. A change in the population adjusted initial jobless claims rate is mirrored in the unemployment rate, frequently with a 1 or 2 month delay:


I've also noted that if we were to be heading towards a "double-dip," we should expect the relationship between the number of initial jobless claims and employment growth to change, whereby in the net many more jobs are lost per any given rate of initial claims. Although there may be some very slight drift in that direction since April (brown points), it hasn't happened in any meaningful way:


The longer term leading relationship of initial jobless claims to the unemployment rate (comparing the last 6 months' average with the average over the same six month period one year prior) as measured by Thumbcharts is also intact:


Finally, back in December 2009, Prof. Paul Krugman said:
I thought it might be useful to create a sort of benchmark for the level of job growth that would really count as good news.…
[L]et’s set a … modest goal: return to more or less full employment in 5 years –which means seven lean years of depressed employment. To keep up with population growth over those 7 years, the United States would have had to add 84 times 127,000 or 10.668 million jobs. (If that sounds high, bear in mind that we added more than 20 million jobs over the 8 Clinton years). Add in the need to make up lost ground, and we’re at around 18 million jobs over the next five years — or 300,000 a month.

So that’s a useful benchmark.
(emphasis mine)

With that in mind, here's a graph of monthly gains in civilian employment from the Household Survey since its bottom:


No, it isn't the more generally reported Establishment Survey data, but the Household Survey does tend to lead at inflection points, and for the last 4 months, the average employment gain in the Household Survey has been 321,000/month, with the lowest being 277,000. I'm not nitpicking the Professor, but it's worth noting that this does meet Prof. Krugman's threshold criteria for actual good employment news.

Monday, November 21, 2011

Getting deep into the weeds about Jobs, Jobs, Jobs

- by New Deal democrat

It's been quite a while since I looked at detailed metrics of future job growth, something I devoted a lot of time to a couple of years ago. With a divergeance in forecasts between recession vs. continued growth, this is a good time to take another look. Some of the metrics have performed better than others. Many continue to support optimism, but at least one is downright ominous and may be telling us that revised jobs data will show substantial job losses from earlier this year.

1. V shaped real retail sales and industrial production recoveries vs. jobs:

One point I frequently made is that this is a "bifurcated recovery", where manufacturing and sales are performing much better than job and income growth. Although we've had a recent slowdown in some ISM series, the description of a "bifurcated recovery" is still valid.

Real retail sales and Industrial production are still in V shaped recovery mode. Real retail sales have recovered 80% from their trough, and industrial production two-thirds:


Comparing those with private jobs (red) and total payrolls (green), we can see that the percentage losses in sales and production were steeper, and have made up nearly or more than all of their ground compared with jobs. Meanwhile, private jobs have regained only slightly over 30% of their losses. When government employment is added for the total jobs picture, less than 25% of the losses have been regained:


2. Comparing improvements in aggregate hours and jobs:

Another point I have frequently made is that aggregate hours worked are recovering faster than new jobs. Since more hours were lost than jobs during the recession, if past was prologue then we would have to wait for aggregate hours to regain their lost comparative ground before job growth would match the growth in hours. This is still the case:


If the trend continues then by about next summer aggegate hours (red) will have made up all of their comparative losses with jobs (blue) and we can start to expect job growth to fully reflect growth in hours.

3. Comparing real retail sales with jobs:

The closest thing I found to a "holy grail" leading indicator for future job growth when I took a thorough look over 2 years ago was real retail sales. Real retail sales tended to lead turning points in jobs by about 4 to 8 months. Since sales are still rising, we should expect continued job growth over the next few months as well. (This metric has also recently been touted by Prof. Karl Smith of UNC - Chapel Hill at Modeled Behavior).

I also found that over the last 40 years, the YoY% growth in real retail sales, divided by two, gave a reasonably close forecast to YoY% growth in jobs, at least over a longer horizon if not every month. Since real retail sales were averaging 6% YoY growth at the end of 2009, this led me to expect strong job growth in 2010. It didn't happen, although measuring by private jobs, the metric is at the moment almost in perfect alignment:


When we add government jobs into the mix, and compare real retail sales with total jobs (green), the metric still falls considerably short:


This is yet another indication of just how significant government job losses have been to the relatively poor jobs recovery. At the same time, because real retail sales are a leading indicator for jobs, this reinforces that we should expect to continue to see positive job growth in the economy, with private jobs at least being added at something like a 2% YoY rate.

4. Comparing initial jobless claims with jobs added:

In 2010 I thoroughly debunked the idea that we needed 400,000 or less in initial jobless claims to be consistent with job growth. It simply makes a lot of difference how deep the recession is, and also the pattern declining into a recession is quite different from the pattern during a recovery. I pointed out half a year ago that if we were to descend into a "double dip", I would expect to see a break in trend in the scatter graph comparing these two series, with a new trend line to the left of the recovery trend line developing. Here is the updated graph (using private jobs vs. all jobs to avoid the 2010 census distortions) , with the last 6 months' data in brown:


No break in trend happened. Since this scatter graph ends with October, it doesn't show the decline in the 4 week moving average below 400,000 in the last couple of weeks. Should that continue through the end of November, I would expect a very good November employment report, with something like 175,000 private jobs being added.

5. Okun's Law

Okun's law is actually a rule of thumb that holds that for every 2% YoY increase in GDP, there should be a 1% decline in the unemployment rate. Generally speaking, 2% YoY GDP growth equals no change in unemployment. A 4% GDP increase gives you a 1% decrease in unemployment. Contrarily a 0% YoY change in GDP gives you a 1% increase in unemployment.

I make use of a corollary, which is the YoY% growth in GDP minus 2% approximately equals the YoY% change in job growth 3 to 6 months later. Here is the graph of this relationship going back 65 years, and it has ominous implications:


Since 1948 there has never been a period of 2 or more quarters where YoY GDP% growth was under 2%, that has not equated actual YoY job losses in the next few months. If this relationship holds true now, then contra all of the other above data, we should have already been seeing outright job losses, and they could continue through the winter.

As I said, this contradicts virtually all of the previous indicators we have discussed. A possible explanation comes via Jeff Miller of A Dash of Insight, who informed us yesterday that the BLS's Dynamic Business Report of actual job data collected from the states showed that in the first quarter of this year only 250,000 jobs were created, rather than the 500,000 previously reported. If this revision is applied to all of the 2011, it would mean that the pathetic job gains of this past summer turn into outright significant losses. Not only would this tend to vindicate Okun's law, it would affect all of the data sets above. For example, the scatterplot graph above would probably then show that we did indeed break trend in the direction of a "double-dip."

6. Forecasts of the unemployment rate:

Finally, let's update a few metrics forecasting the unemployment rate. The premise here is that initial jobless claims are a leading indicator of the unemployment rate. The best way to measure initial claims, however, is to adjust for population, which is done in this first graph:


So adjusted, the recent initial claims levels aren't so bad. In fact, they are better than most readings during the last 50 years.

This metric had an excellent record for predicting the unemployment rate several months out -- until this recovery. It predicted an unemployment rate of under 7%, and needless to say were are far above that:


Taking a closer view of the last several years, it appears that the big disconnect occurred in 2009, when initial claims steeply declined, yet unemployment remained stubbornly high. Since then, the two series have tracked one another rather well. This suggests we should see the unemployment rate drop slightly to about 8.8% in the next few months:


Finally, here is a slightly different metric from Thumbcharts. This compares the last six month period with the same six month period one year before. In this longer term metric, initial claims also have an excellent record predicting the unemployment rate -- although like the metric above it shows that the YoY decline in initial claims considerably outpaced the decline in the unemployment rate a year ago:


This metric likewise predicts a continued decline in the unemployment rate over the next few months.

Summary

Continued job losses in government continue to have a depressing impact on job growth during this recovery, causing distinctly subpar growth compared with previous recoveries. Undoubtedly as I have pointed out just a few days ago, that housing until recently did not participate in the jobs recovery also has had an effect.

At the same time, most of the above metrics suggest that we should see continued job growth in the months ahead, and a continuing decline in the unemployment rate compared with a year ago. If present underlying economic trends continue (as to which there is obviously no guarantee), then by next summer or so we may see stronger job growth as the deficit in aggregate hours is completely made up.

The contrary indicator is Okun's law, which suggests we should already be in the throes of actual job losses. It is possible that we will find when the jobs data is revised that we did lose a significant number of jobs earlier this year, but that the situation will improve going forward from here, which would be more consistent with all of the data sets above.

Thursday, March 10, 2011

The Bifurcated Unemployment picture: unaffected college grads vs. emigrating Latinos?

- by New Deal democrat

As promised, I want to take a closer look at the latest unemployment statistics. The February jobs report showed a decline in the unemployment rate of almost 1% in the last three months. More specifically, the unemployment rate for African Americans has declined from 16.0% to 15.3%; and for Latinos from 13.2% to 11.6%. Is the news for minorities as improving as the numbers make it look, or is there something else going on? Put another way, is the decline in the unemployment rate "real" or it it people becoming discouraged and dropping out of the labor force?

The BLS starts with the working age population. People in that set are either in the labor force, or not in it. Of the subset of people in the labor force, there are further subsets of employed or unemployed. So if people drop out of the labor force (as defined by the BLS), they are no longer counted as unemployed. But that distorts the unemployment rate, making the employment situation look better than it really is.

To test how much of the drop in the unemployment rate was "real" vs. "discouraged workers" who dropped out of the labor force, I crunched some numbers to get a "real" unemployment rate. First, I held the "not in the labor force" ratio constant from November to February , exactly as it would be If there were no increase in discouraged workers in the last three months. Since the BLS helpfully produces a statistic called the "employment-population ratio", then all I have to do is create an "unemployed-population ratio" that is the mirror image of that change. Next I take the 3 month change in that "unemployed-population ratio" and solve for the equivalent change in the "official" unemployment rate, creating a "real" rate. The difference between the "real" unemployment rate vs. the actual unemployment rate shows how much of the decline is persons dropping out of the labor force.

Thus, for example, if in November 60% of the working age population were employed, 10% unemployed, and 30% not in the labor force, then in February if 61% were employed, by holding the labor force constant as a percentage of the working age population, 9% would be unemployed. The change in the unemployment-population ratio is 10:9. If the unemployment rate in November were 6%, holding the labor force constant gives us a predicted unemployment rate of 5.4%. (10:9 = 6:5.4). The extent to which the actual February unemployment rate is different from 5.4% tells us how much of the change in the unemployment rate is "real" vs. persons dropping out of (or entering) the labor force.

I performed this exercise for the population as a whole, and also by race (white, black, Latino), and also by level of education. The results were in stark contrast.

First, here is the total result and results broken down by race:

Race or
ethnicity
Nov. 2010
unrate
Feb. 2011
unrate
Nov. 2010
un-pop ratio
(emply-pop)
Feb. 2011
un-pop ratio
(emply-pop)
Feb. 2011
"real"
un- pop ratio
Feb. 2011
"real"
unrate
Total9.88.96.3 (58.2)5.7 (58.4)6.19.5
whites8.98.05.8 (59.0)5.1 (59.4)5.48.3
blacks16.015.310.0 (52.5)9.5 (52.2)9.715.5
latinos13.211.68.8 (58.4)7.6 (58.4)8.813.2


Now here are the results by education level:

Education
level
Nov. 2010
unrate
Feb. 2011
unrate
Nov. 2010
un-pop ratio
(emply-pop)
Feb. 2011
un-pop ratio
(emply-pop)
Feb. 2011
"real"
un- pop ratio
Feb. 2011
"real"
unrate
H.S. dropout15.713.97.3 (39.3)6.3 (39.2)7.415.9
H.S. graduate10.09.56.1 (55.0)5.7 (54.6)6.510.7
some college8.77.66.0 (63.8)5.4 (64.1)5.78.3
college diploma5.14.34.0 (72.7)3.3 (73.6)3.14.0


(N.B.:In the above graphs, "unrate" means "unemployment rate". "emply-pop" is the employment to population ratio - in parentheses. "Un-pop" is the unemployment to population ratio, actual for November, and adjusted for February with the labor force held constant. The two bolded columns are the "official" vs. "real" unemployment rates).

First of all, as to the population as a whole, only 1/3rd of the decline in the unemployment rate - 0.3% of 0.9% official decline - is due to actual employment gains. The other 2/3rd's is due to people dropping out of the labor force.

But two things really stand out:

1. the decline in the unemployment rate among college graduates is very real, in fact it is understating the change, because college grads are re-entering the workforce. By contrast, we can see that the lower one goes on the education scale, the less the "real" decline in unemployment, to the point where the "real" unemployment rate among those who only have a high school diploma or less, has actually increased in the last three months. This means that highly educated workers are returning to the workforce, but low-skilled workers are dropping out - and this during the best five month period for employment gains in the last three years.

2. something is going on with Latinos. Broken down by race/ethnicity, fully 2/3rd's of the decline in unemployment among both whites and blacks is "real." By contrast, there has been NO decline whatsoever in the "real" unemployment rate among Latinos.

By my figuring, if their participation rate had remained the same, there would have been 545,000 more unemployed Latinos than counted -- compared with 578,000 whites and 232,000 blacks. Considering Lationos make up only about 13% of the population, that is a HUGE dispartiy. And that is on top of the annual January population readjustment of -187,000 Latinos, vs. -233,000 whites -- and an upward adjustment of blacks -- which again is a huge disparity.

So why are Latinos dropping out of the population, and the workforce in such disproportionate numbers? I suspect the answer has to do with both voluntary and coercive emigration. Either a significant number of undocumented or marginally documented are returning to their home countries because of poor economic conditions here, or involuntarily due to fear of stepped up immigration enforcement or actual deportation.

The biggest categories of people who have dropped out of the labor force in the last three months are people with high school degrees but no college. This accords with the fact that the sectors hardest hit over the last few years have been construction and manufacturing. Both of those sectors employ blue collar physical laborers frequently with only a high school diploma or less. These are the people whose jobs are being replaced either in Asia or by robots, or nonexistent due to the 5 year old construction bust.

This also explains two puzzling and maddening facts about our society: as this graph courtesy of Matt Trivisonno shows, every month more and more Americans are going on food stamps:


Meanwhile, as this column among others points out, the Village of Washington, D.C. is full of college graduates who can't understand what the fuss is all about, and have moved on to "shared sacrifice" by the little people in the hinterlands.

Monday, March 7, 2011

The Jobs Report big picture in 5 graphs

- by New Deal democrat

On Friday I showed that the trend of increasing jobs reports was intact, when one bears in mind that for 12 of the last 13 months, the final revision was on average about +50,000 higher than the initial report. Even after the yearly benchmark changes that was still true for 9 of the twelve months of 2010.

Today let me update 5 graphs that I have been running over the last few months in some cases, and for over a year in others, to show some "big picture" correlations with the jobs report. All of these show data that has reliably led the jobs picture by weeks (the first graph) or months (the next two), or has led the unemployment rate by months (the last two).

First of all, here is the scatter graph of initial jobless claims (left) and monthly jobs gained/lost (bottom) for the last two years. Blue is all private jobs, red includes government jobs as well (except I have excluded the March through August 2010 period which was distorted by census hiring and firing):


As you can see, there is a nearly linear relationship. So long as initial claims continue under 400,000, we should expect robust monthly jobs reports (with a very big +/-125,000 variance, however). It is also important to note that we have been shedding government jobs for the entire two year period, without any "double-dip." While laying off government workers now is insane policy, and will be a drag on the economy, it is safe to say that it alone will not be enough now or during this summer to cause a renewed recession.

Next, let's look at jobs vs. GDP. This is a series I have been running for well over a year. Despite the complaints that GDP does not measure the happiness of Main Street, the fact remains that it is an excellent way to predict YoY jobs over the next 6-12 months. Subtract 2% from the YoY percentage growth of GDP, and you will be very close to the YoY% of jobs growth a few months later. Here is that graph now:


As you can see, it remains an excellent predictive tool.

Third, let's look at real retail sales vs. jobs. This is another series I have been running for well over a year. It is updated monthly, and so gives earlier signals of turning points than GDP. While it remains an excellent tool for the direction of YoY job growth, it has not performed so well in the last year:


My suspicion is that it is not performing so well this time around because the retail sales do not include those sales associated with new home sales and home improvements, compared with other recoveries. Nevertheless, if real retail sales continue to predict 3% annual job growth for an extended time, I expect job growth to trend in that direction.

In summary, the above graphs strongly suggest that we will continue to see jobs reports that at very least keep up with population growth in the coming three to six months.

Now let's look at two graphs comparing initial jobless claims with the unemployment rate. First, courtesy of Thumbcharts, is a graph comparing the average of the last last 6 months of initial claims (blue) and the unemployment rate (red) over the same period, with the equivalent 6 months the year before. With the exception of the double-dip 1980-1982 recessions, this has an excellent track record.


As the readings from last August and September disappear, the initial claims average will continue to decline YoY, and this predicts that there will continue to be a substantially lower unemployment rate than the same period a year ago. While this might not mean further decline in the unemployment rate from here, it very strongly argues against any significant increase back above 9% in that rate.

Finally, let's look at initial jobless claims as a percentage of the population vs. the unemployment rate. This is the graph I began running about 3 months ago when I was totally surprised by the close and long-lasting fit (although there has been a slight drift upward over the long term in the unemployment rate vs. claims):


This graph argued 3 months ago that the unemployment rate was far too high compared with initial claims. Since then the unemployment rate has declined 0.9%!!! As population-adjusted initial claims has consistently led the unemployment rate for almost 50 years, this graph suggests that further declines in the unemployment rate in the coming months are likely. If so, the dramatic drop in the unemployment rate could be the surprise economic story of 2011.

The question remains, however, how much of the decline in the unemployment rate is an unalloyed good and how much has to do with participants dropping out of the work force. I will get down into the weeds on that subject in my next post.

P.S. One note of final emphasis: I'm not just running the above graphs because of their performance in the past. Not infrequently in the last couple of years at DK I would get comments on the order of, "Pretty graphs. But they have nothing to do with reality. Everything sucks, and it's going to get worse." And yet, the "pretty graphs," which are just easy to digest representations of complex data, showing how A has relentlessly led to B over a very long time, have prevailed. If the pretty graphs kept kicking my ass, I would seriously reconsider my position. In summary, they still lead now, and are giving us a good look at what we should expect from the monthly jobs reports in the next few months.

Wednesday, December 22, 2010

New Jobless Claims and the Unemployment Rate continued (II)

- by New Deal democrat

On Friday I posted the below graph that showed the very surprising close and leading correlation between initial jobless claims adjusted for population (the "initial jobless claims rate") and the unemployment rate:


So close is the correlation that the initial jobless claims rate predicts the unemployment rate 3 months later within 2% in all but 31 of 524 months - about 93% of the time, and predicts the unemployment rate within 3% all but 13 times, or 97.5% of the time:


It appears there is a slight secular trend higher in this metric in the long term. I will address this in point 4 below. (Note: my co- blogger Silver Oz has put this relationship together in a spreadsheet. If you would like a copy, let us know in the comments section).

On Monday I showed an alternative, similar measure caclulated from the YoY change in the 6 month averages in the two metrics.

Both ways of looking at the data show that this past year has been an exception to the rule: the unemployment rate has remained stubbornly high and unchanged even though initial claims have dropped by over 20%.

On Friday I suggested that the exceptional circumstances prevailing now meant that layoffs were actually no longer higher than average for the last 50+ years. Rather, the issue was a lack of new job creation.

I believe there are 4 reasons that give rise to this exceptional situation in which job creation has not been as strong as compared with the leading metrics. Numbers 1 and 2 are unique to this recovery, while number 3 and 4 are continuations of a trend - and in the case of number 4, a continuation at a completely new scale:

1. The expiration of the $8000 housing credit distorted the normal recovery pattern. Construction growth is not only failing to lead this recovery, but there has been no net construction hiring 19 months after the bottom of the economy.
2. In accord with number 1, and drastic cutback in fiscal aid to the states after one year has pushed job losses that would otherwise have taken place in 2009, into 2010, instead of renewed hiring beginning.
3. Manufacturing job growth is taking place in Asia in response to renewed American consumer demand.
4. Growth in hiring has been replaced with growth in hours.

Let's look at them in turn.

1. Housing

As part of the February 2009 economic stimulus package, Congress passed an $8000 housing credit. In response, housing sales and prices, both of which had been plummeting, stabilized and housing sales actually increased. When the stimulus was originally planned on being terminated in October 2009, and then when it actually did terminate at the end of April 2010, housing starts and permits dropped again, all the way back to their previous lows, and decreased demand showed up in dropping prices as well.

Prof. Edward E. Leamer made a persuasive case several years ago that housing booms and busts always lead the economy into and out of recessions. With the huge housing hangover, there has been no such growth yet, and construction jobs have flatlined as shown in this graph:


Bill McBride, t/a Calculated Risk, has produced this graph over the last few months showing that housing permits and starts lead the unemployment rate:


It is obvious they are still affecting it.

2. Of a piece with the housing stimulus is the saga of Congressional fiscal aid to the states, which was forthcoming in 2009, grudgingly and only partially extended for one more year in June 2010. State and local layoffs, which otherwise would have taken place in 2009, have taken place in 2010 instead. If you needed the reminder, here is the graph of local employment. Over 250,000 jobs in this sector have been lost.


As to both housing and state and local government employment, what happened is a shift in layoffs. There would have been more layoffs and a steeper climb in the unemployment rate in 2009, and most likely a decline to where we are now this year. Instead the unemployment rate has flattened.

3. Another piece in the puzzle has to do with imports. Intermodal containers are typically the boxes that arrive via ship on the West Coast, and then are transported by rail to other locations.

Consider this graph of intermodal transit on railroads:


Consider also this graph of Los Angeles port traffic:


Although real retail sales have rebounded approximately 2/3 from their recession low, intermodal container imports and rail transit have made up essentially all of their lost ground. In other words, American cnsumer demand stimulated production in Asia, not manufacturing jobs in America.

4. Growth in hiring has been replaced with growth in hours.

The Great Recession, unlike prior recessions, including other severe recessions, hit service jobs every bit as hard as manufacturing jobs. Fully half of the 8 million or so jobs lost during the recession came from services. No other prior recession comes even remotely close to that percentage:


In short, this was a broad based drastic decline in jobs across the entire spectrum of the economy.

I submit that the Recovery in employment is taking place, relatively speaking, in the amount of hours worked, rather than in the number of jobs gained, and until that is resolved, metrics like the initial jobless claims rate (and real retail sales too) compared with employment and unemployment will lag compared to prior recoveries.

This in my opinion is the crucial graph -- average hours worked in private industry:


As you can see, it has been in decline for half a century. What this means is, every time there is a recession, there are more and more hours available to be increased in the workforce before new hires need to be brought on board. To see that, first let's look at the following graphs, in which for each recovery, the YoY percentage change in jobs is subtracted from the YoY change in hours. Here are the 1970s and 1982 severe recessions:


And here are the more recent "jobless recoveries:"


As you can see, in earlier recoveries the number of hours initially grew faster than the number of jobs, but quickly reached a "saturation point" after which jobs grew just as fast. In more recent recoveries, the saturation point was very lately, if ever, reached.

Let's now look at the actual growth in jobs and hours over time. In this next graph, the last half century's data is normed so that the 1981 peak is at 100. You can see that before then, jobs grew faster than hours. After that, the growth looks a little more equivocal.


When we look at the same data over the last 10 years normed so that the 2007 peak is normed to 100, the change becomes much more obvious.


Since 1981, jobs and hours over the long term have grown about equally. Hours decline more in recessions, and grow more in recoveries. In the Bush economy, the number of hours worked only caught up with the number of jobs gained in 2007 - just in time for the Great Recession. Since bottoming a year ago, half of the difference in the declines has been made up.

Let me show you the same data one more way. This is the same information above in YoY terms:


If it looks like gradually hours are being added faster in expansions, and job losses are increasing relatively speaking in recessions, then this next graph, with payroll changes amplified 1.6 times so that the YoY changes in the last 10 year are almost identical, should make it obvious:


It is now easy to see that over time, fewer and fewer jobs were gained in economic expansions, and more jobs were shed during recessions, relative to hours worked.

So let's put together the above 4 points into a conclusion.

There has been a lag in job growth and unemployment decline compared with historical norms as to any number of metrics, including but not limited to the initial jobless claims rate and real retail sales. This is due in part to distortions due to the economic stimulus package of February 2009 which delayed and blunted losses in residential construction and state and municipal labor, which have continued to take place later than usual. In particular, one normal leading engine of recovery - residential building - is still bouncing along the bottom.

Additionally, the rise of offshoring on a secular basis has meant that increased spending by Americans is, relative to past recoveries, stimulating job growth in Asia rather than in America.

Finally, the secular reduction in average weekly hours worked in America means that there is much more slack to be taken up by growth in hours than by growth in jobs.

This does not mean that the historical metrics aren't relevant. There are signs in things like architectural billings, rail freight related to housing, and prices for housing that in real terms are lower in some markets than at any point in the last 25 years - that suggest both residential and nonresidential construction may start to grow together at some point in the next 4-8 months. Additionally, if hours continue to regain lost ground relative to jobs at the same pace as they have in the last 12 months, then by about the end of next year hours will have caught up with jobs, and if we avoid another crisis we can expect job growth to accelerate.

In short, the correlation may be delayed, but most likely it will assert itself in 2011.

Share

Twitter Delicious Facebook Digg Stumbleupon Favorites More