logo

Showing posts with label economy. Show all posts

Saturday, August 18, 2012

Weekly indicators: summer doldrums edition


  - by New Deal democrat

The monthly data for July released last week was almost all quite positive. Retail sales, industrial production, capactity utilization, and housing permits all rose quite strongly. Consumer sentiment rose slightly. As a result of permits, the Conference Board's Leading Index increased, exactly reversing June's decline. Consumer prices did not rise at all. Producer prices rose +.3. The only significant negative news was that both the Empire State and Philly regional manufacturing indexes both contracted.

I report on high frequency weekly indicators because they are as close as we can reasonably get to observing economic trends in real time.  Turns will show up here before they show up in monthly or quarterly data.  Recently I've been focusing on consumer purchases and the effects of the Oil choke collar as the keys to the economy for the second half of this year.

So let's start once again this week with Same Store Sales and Gallup consumer spending, which were again positive:

The ICSC reported that same store sales for the week ending August 11 fell -0.3% w/w, but rose +3.6% YoY.  Johnson Redbook reported a 2.0% YoY gain.  Shoppertrak did not report.

The 14 day average of Gallup daily consumer spending as of August 16 was at $78, $7 over last year's $70 for this period.  This is the third week of real strength after six weeks in a row of weakness. This is very encouraging but we will still have to see if consumers are regaining their footing.

On the other hand, the energy choke collar has now re-engaged, while there is some enocuraging news agout gasoline usage.

Gasoline prices rose yet again last week, up $.07 from $3.65 to $3.72, and are now higher than a year ago.  Oil prices per barrel also rose for the week, from $92.87 to over $95..  Gasoline usage, at 9308 M gallons vs. 9195 M a year ago, was up for a change, +1.3%  The 4 week average at 8907 M vs. 9163 M one year ago is off -2.8%. August last year is when the precipitous YoY declines in gas usage began to be registered. That we have a positive 1 week YoY comparison is encouraging, but it must continue to not signal further weakness.

Employment related indicators were mixed this week.

The Department of Labor reported that Initial jobless claims rose 5000 to 366,000 from the prior week's unrevised figure.   The four week average fell by 4,500 to 363,750,, only 750 above the lowest 4 week average during the entire recovery.  Needless to say, this number does not appear to be compatible at all with further economic weakness.  -

The Daily Treasury Statement showed that for the first 12 days of August 2012, $85.0 B was collected vs. $85.1 B a year ago.  For the last 20 days ending on Thursday, $131.6 B was collected vs. $126.1 B for the same period in 2011, a gain of +4.3%.

The American Staffing Association Index held steady at 93.  This index was generally flat during the second quarter at 93 +/-1, and has returned to that level after its July 4 seasonal slump. It nevertheless is not rising from that range and so indicates significant weakness.

Bond yields rose while credit spreads shrank:

Weekly BAA commercial bond rates rose another .09% to 4.89%.  These remain close to the lowest yields in over 45 years. Yields on 10 year treasury bonds also rose 0.11% to 1.65%.  The credit spread between the two declined to 3.24%, which is about halfway between its 52 week maximum than minimum, and a significant improvement from one month ago.  Tightening credit spreads are a good sign.

Housing reports remained mixed:

The Mortgage Bankers' Association reported that the seasonally adjusted Purchase Index declined -2.0% from the week prior, and were also down -4.9% YoY, back into the lower to middle part of its two year range. The Refinance Index fell -5.1% but is still near its 3 year high.

The Federal Reserve Bank's weekly H8 report of real estate loans this week rose +0.8% for the week.  The YoY comparison rose to +1.2%.  On a seasonally adjusted basis, these bottomed last September and are also up +1.3%.

YoY weekly median asking house prices from 54 metropolitan areas at Housing Tracker  were up + 2.3% from a year ago.  YoY asking prices have been positive for over 8 months.

Money supply remains generally positive despite now being compared with the inflow tsunami of one year ago:

M1 was off -0.6% last week, and was flat at 0.0% month over month.  Its YoY growth rate fell from +13.9% to +10.7%, as comparisons with last year's tsunami of incoming cash are in full progress. As a result, Real M1 declined to +9.3%. YoY.  M2 fell -0.2% for the week, and was up 0.3% month/month.  Its YoY growth rate fell from 7.4% to +6.5%, so Real M2 grew at +5.1%.  Real money supply indicators are now declining as the tsunami of cash arriving from Europe last summer disappears from the comparisons.

Rail traffic was slightly positive while its diffusion index declined:

The American Association of Railroads  reported a +0.8% increase in total traffic YoY, or +3,800 cars.  Non-intermodal rail carloads declined -1.2% YoY or -3,800, once again entirely due to coal hauling which was off -7,300.  Negative comparisons rose back from 6 to 8 types of carloads.  Intermodal traffic was up 7,400 or +3.2% YoY.

Turning now to high frequency indicators for the global economy:

The TED spread rose from its 52 week low of 0.34 to 0.37. The one month LIBOR declined to 0.237, an 111 month low.. It remains well below its 2010 peak, and has still within its typical background reading of the last 3 years.  Even with the recent scandal surrounding LIBOR, it is probably still useful in terms of whether it is rising or falling.

The Baltic Dry Index fell from 774 to 714, only 44 points above its February 52 week low of 670.  The Harpex Shipping Index fell another 2 points to 398.  It is up only 25 from its February low of 375.

Finally, the JoC ECRI industrial commodities index fell from 119.10 to 117.89. This is still near its recent 52 week low.  YoY comparisons for this number will shortly improve (or get less worse) as its August 2011 swoon will leave the comparison period.  Nevertheless, its decline remains a strong sign  that the globe taken as a whole has been slipping back into recession.

Like the positive monthly indicators for July, most of the weekly indicators were at least slightly positive this week, including sales, the 4 week average of jobless claims, the 20 day sum of withholding taxes paid, credit indicators, housing prices and real estate loans, and money supply. The most significant negative is gasoline prices which have risen back into the choke collar zone. Mortgage applications declined. Staffing services were weak.

Global indicators of shipping and industrial metals prices continue to indicate a downturn. By continuing to expand moderately, the US remains the world's least worst economy.

Have a nice weekend!

Friday, August 17, 2012

Not good enough


- by New Deal democrat

Three years ago I was arguing with Doomers on Daily Kos who thought that, as awful as things were, they were only going to get worse and worse as we fell into the bottomless abyss, quoting Zero Hedge and The Automatic Earth as gospel scripture that we were going to 25% unemployment and 1000 on the Dow Jones Indsutrial Average.

Since then, I've countered the double-, triple-, and quadruple-dippers who have mistaken every spring slowdown for vindication. Over the last 9 months or so, I seem to have become the poster child for disagreeing with the very prominent forecasting firm ECRI, who thought we might already be in a recession, or one was "right in front of us," almost 1 full year ago.

I stand by all of those calls, because that's what the data showed me.

But pointing out that the economy isn't actually contracting is a far different opinion than believing the economy is in anything remotely close to good condition. It isn't. It's in terrible condition, and all its advances grow more and more precarious as time goes on.

In a liberal democracy like the US, the desiderata of the economy ought to approximate the greatest good for the greatest number. Instead, for possibly as long as the last 40 years, but certainly since 2000, a majority of Americans have almost certainly fallen behind, a condition that looks ever more chronic as wage growth declines to 0% YoY. A defaltionary wage and debt spiral becomes a greater and greater possibility, even if its timing is not yet known.

It is simply not good enough that the economy is growing. Real income growth is paltry. Job growth is mediocre at best. The plutocrats and the banksters -- generally, the creditor class -- have been made whole or at least kept afloat via bailouts. Debtors have been left to fend for themselves. That is a recipe for not just months or years of malaise, but possibly decades. Supply does not create its own demand. Yes, efficient new goods will find markets. But otherwise we need growing demand to justify expansion of supply.

Unless and until the well-being of the shriveling American middle class is placed front and center, there will be no full recovery. While the Doomers have been wrong at every turn for the last three years, there should be no mistaking the fact that simple growth in the economy is simply not good enough.

Stagnating wages are hurting the economy RIGHT NOW


- by New Deal democrat


The global economic weakness that has intensified as this year has progressed has greatly tamped down inflation. If wages were growing at a reasonable rate, this would help jump-start demand.


But wage growth has been declining for years, and is considerably worse than even during the Great Recession. As a result, even though inflation Is now only running at 1.4%, wage growth at only 1.3% is still not quite keeping up, as shown in the graph below:


Thus, while real wages have improved slightly in the last few months, they still are below the average levels of the last four years:


If we can avoid another inflationary spike in the next few months due to gas prices - by no means a sure thing - inflation should be less than 1%YoY in a couple of months:


Per my past postings, if inflation bottoms out at that point, that should mark the low point of the recent weakness. But we are getting ever closer to the point where wage stagnation rolls over into actual wage deflation.

Morning Market Analysis


The entire treasury curve continues its move lower.  All sectors have broken upward sloping tend lines and have bearish MACD formations.  Money is flowing out of the markets and volatility is increasing.  The next logical target is the 200 day EMA on the TLTs.


The SPYs have moved to a six month high.  Momentum is rising, the EMA picture is bullish and money is moving into the market.


The QQQs are approaching a 6 month high.


The IWMs are still weak, but yesterday's price action eases the negative reading.  The EMAs are moving higher and momentum is positive.  But the CMF is still negative.  Ideally, we'd like to see a stronger move in this market to confirm the rally.


Oil has broken out from its consolidation.  The price target is 100 (lows that were established in early April).


Thursday, August 16, 2012

Dude, where's my recession? Housing and Initial jobless claims


- by New Deal democrat

Two piece of economic data released this morning make it considerably harder for bears to argue that we are slipping into, let alone already in, a new recession.

Housing permits rose to 812,000. This is the first time over 800,000 and the highest level in 4 years. Permits have risen over 200,000 on an annualized basis over the last year. The now-strong upward trend in permits, generally consistent in the past with GDP over 3% in the near future, is evident on the updated graph below, showing permits in blue, private residental construction spending in red, and residential construction employment in green:


You can see that permits lead spending, which in turn leads construction employment. Needless to say, the rise in permits is bullish for both residential construction spending and future employment.

Also this morning the four week average for first time unemployment claims fell to 363,750, only 750 or 0.2% above its lowest reading during the entire recovery:


No recession has ever begun within 2 months of such a reading.

There are certainly major problems with the expansion, most notably the plateauing of consumer retail spending since this year began, and the complete stalling and perhaps slight contraction in manufacturing. But this morning's releases put an exclamation point on the proposition that the expansion hasn't expired yet.

Coincident economic indicators rise


  - by New Deal democrat

We now know the values for July for 3 of the 4 indicators that the NBER uses to mark economic peaks and troughs.

Nonfarm payrolls were reported up 163,000 for the month.  Further, their YoY growth has been acceleratiing slightly a compared with earlier this year.

This morning Industrial production was reported at +0.6.  Production made another post-recession high in July, and is now only about 2.5% less than its pre- Great Recession peak, as shown on the graph below:


The YoY growth has decelerated slightly.

Yesterday retail sales were reported up 0.8%  for July.  With this morning's flat CPI report, we now know that real retail sales were also up 0.8%. (Based on Gallup's spending data, I had thought these would come in poor. I was wrong, but happily so.)  This reverses last month's decline, although we are still below the levels set in February and March.  These are about 1.7% under their pre- Great Recession peak:


The final coincident indicator, real income, won't be reported for another couple of weeks.   Barring downward revisions, however, it seems likely that the economic expansion continued in July.

Morning Market Analysis: Long-Term Europe Edition


The weekly Spanish chart shows the market may be making a bottom.  First, notice the depth of the sell-off; prices moved from 40 to about 21 for a drop of almost 50%.  However, prices have twice attempted to sell-off to the 20/21 area.  Also note the first sell-off was done on much higher volume than the second. 


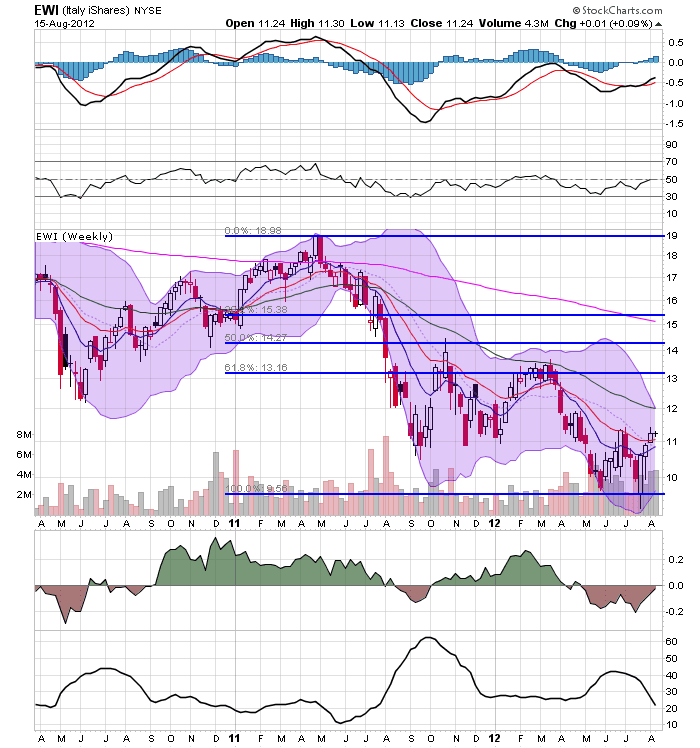
The Italian market is in a similar situation as the Spanish market, but the above chart has a less clear double bottom signal.  There is a heavier volume picture, but it's not as clear-cut as the Spanish market. 


The weekly chart of the British market shows that -- despite three quarters of contraction -- the market is actually consolidating in an ascending triangle pattern.  While the British economy is weak (they've had three quarters of contraction), it has benefited from capital inflows as a result of its haven status.


The weekly chart of the French market shows that prices have been consolidating in a sideways pattern for nearly a year.


The weekly German chart has no pattern.  However, prices are right at the 200 day EMA and are in the middle of a multi-month rally.

Wednesday, August 15, 2012

Will We See Second Half Improvement, Part III; Housing

Let's continue our look at the possibility of a second half rebound by looking at housing.  We'll first look at new home sales, which account for a small portion of the real estate market.


Look at the data from the long term perspective, new home sales are still at very low historical levels.  However


Note the increase over the last 9 months, where we see an increase form a ~300,000 annual pace to an ~360,000 pace.


This is the chart that I find most important: new home inventory is not at very low levels historically.  That means builders will have to bring more inventory on line soon, which is exactly what we're seeing:


Building permits for i-unit structures are clearly increasing, and have been for about a year and a half.

Let's turn to the existing home market.


The overall sales sales pace has been pretty constant for the last two years.  Notice that this is in line with the historical norms of the early 1990s.


This, for me, is the defining chart of the housing market.  The overall months of supply is down to far more realistic levels in a months available for sale measurement and


and absolute amount of inventory measurement.

Also note that home prices are now rising:

Home prices rose for the fourth month in a row in May, suggesting the recovery in the housing market continued to gain traction, even as the broader economy wobbles.
.....
The S&P/Case-Shiller composite index of 20 metropolitan areas gained 0.9 percent in May from April on a seasonally adjusted basis, topping economists' expectations for a 0.5 percent gain.
.....

"Real estate continues to show improvement off the bottom. That's one of the few encouraging signs we've seen," said Subodh Kumar, an investment strategist at Subodh Kumar & Associates in Toronto.

On a non-seasonally adjusted basis, prices fared even better, jumping 2.2 percent. Compared to a year ago, price declines moderated to slip 0.7 percent, the smallest drop since the last time year-over-year prices rose in September 2010. 

Morning Market Analysis


The entire grains complex is still at elevated levels.  Corn and soybeans are still trading in a sideways pattern while wheat has moved lower, with prices targeting the 50 day EMA.  Considering the USDA recent downgraded the US crop estimate again, I would use the sell-offs as a buying opportunity.


The euro is in a downward sloping channel, largely as the result of the economic events in the region.  While we see two counter-trend moves -- one in June and another from mid-July to mid-August -- the overall trend is still lower.  With the EU printing a negative GDP report, expect this trend to continue.

Tuesday, August 14, 2012

Morning Market Analysis


After moving through upside resistance, the Chinese market hit the 200 day EMA and has since sold off to the 10 day EMA.  However, the price bars on the chart are quite moderate; they look like a standard, profit-taking sell-off rather than a panic sell.  Also note the underlying technicals are still solid: the MACD is rising, the CMF shows money flowing into the market and the RSI is higher. 


The Indian market is still under the high established at the beginning of July along with the 200 day EMA.  Also note that prices have been moving sideways for the last week, hitting support at the 10 day EMA today.


The Brazilian market has moved through resistance but, like the Indian market, is moving weakly sideways.  We do see a better EMA picture, with the shorter EMAs rising through the 50 day EMA.  Additionally, there is a stronger MACD and CMF picture as well.


Copper isn't rallying at all.  Instead, we see prices stuck in a range between 42 and 44 for the last three months.  All the shorter EMAs have a downward trajectory as does the 200 day EMA.  The MACD is weak and the CMF is slightly positive.  Dr. Copper is not signaling a strong economic environment coming around the bend.


Oil prices are consolidating in an ascending triangle formation, which also uses the 200 day EMA as upside support.


Monday, August 13, 2012

Friday, August 10, 2012

Some Points Just Aren't Debatable

The policy paper issued by the Romney campaign has received a rather harsh reaction since its release.  Brad Delong provided the most well-researched and in-depth response (which should probably be called a very thorough smack-down), but there were others (see here and here).

Most telling, a reporter contacted the economists cited in the report as in one way or another supporting the Romney camp's claims, who responded like this:

Each of these sections include supporting documents from independent economists. And so I contacted some of the named economists to ask what they thought of the Romney campaign’s interpretation of their research. In every case, they responded with a polite version of Marshall McLuhan’s famous riposte. The Romney campaign, they said, knows little of their work. Or of their policy proposals.

The real point of controversy for me was this assertion by the four idiots:

The negative effect of the administration’s ‘stimulus’ policies has been documented in a number of empirical studies. Research by Atif Mian of the University of California, Berkeley, and Amir Sufi of the University of Chicago showed that the cash-for-clunkers program merely moved new car purchases ahead a few months with no lasting effect.

DeLong responded thusly:

Such policies are supposed to shift demand forward in time into periods where the crisis is acute from future periods in which, it is hoped, demand is less slack. When Mian and Sufi present their work, they characterize it not as showing the failure but rather the success of programs like CFC.

In actuality, of the studies done on the effect of the stimulus, 13 of 15 found it worked.   Put another way, "a number of empirical studies" does not support the conclusion that the stimulus didn't work.  In fact, the exact opposite is true.  And for God's sake -- the textbook written by one of the authors of the study (Greg Mankiw) argues for stimulus in the event of recession (Mankiw's place in the study has been criticized by Professor Marc Thoma, who asked, "Why would someone undermine their professional reputation defending Romney's indefensible economic policies? What's the expected payoff?). 

 But more to the point, I'm still amazed at the continued existence of the "stimulus doesn't work" argument because it does -- clearly and effectively.

How do we know this?

First consider that the effect of fiscal stimulus during the great depression:


You'll notice that GDP returned to 1920 levels by 1937.  That's a very positive effect.

Then there is the experience of China during the last recession, which spent about 1/3 of their GDP on stimulus, leading to strong growth rates.

And as for the countries that are in the middle of an austerity program right now?  They're all slowing down or in recession (see the UK as a prime example).  And about the "Baltic miracle" -- you might want to look at the data because the US economy is actually performing better than they are.

Here's the deal: counter-cyclical stimulus spending works.  It worked in the Depression.  It worked for the Chinese in 2008.  The vast majority of  studies (13 of 15 or 86.7%) say it worked.  The opposite fact pattern -- austerity programs -- leads to contraction.

How much more data do you need? 

Simon Wren-Lewis has this to say:

 Now the quote comes from a paper prepared for the Romney presidential campaign. It is clearly political in tone and intent. As both academics are Republican supporters, it may therefore seem par for the course. But it should not be. The Romney campaign publicised this paper because it was written by academics – experts in their field. It allows those who oppose fiscal stimulus to continue to claim that the evidence is on their side – look, these distinguished academics say so.

It is one thing for economists to disagree about policy. It would also be fine to say I know the evidence is mixed, but I think some evidence is more reliable. It is not fine to imply that the evidence points in one direction when it points in the other. I say here imply, because the authors do not explicitly say that the majority of studies suggest stimulus is ineffective. If they chose their words carefully, then you have to ask whether ‘intending to mislead’ is any better than ‘misrepresenting the facts’. Was that the intent, or just an isolated unfortunate piece of bad phrasing? All I can say is read the paper and judge for yourself, or this post from Brad DeLong.

This is sad, because it tells us as much about economics as an academic discipline as it does about the individuals concerned. In the past I have imagined something similar happening in physics. It actually stretches the imagination to do so, but if it did, the academics concerned would immediately lose their academic reputation. The credibility of their work would be questioned.  Responding to evidence rather than ignoring it is what distinguishes real science from pseudo science, and doctors from snake oil salesmen. 


Thursday, August 9, 2012

YoY S&P 500 change is a yellow flag


  - by New Deal democrat

As most everyone knows, the stock market is a leading indicator for the economy.  A cursory look at its growth since the March 2009 bottom shows that its advance has slowed over the last year or so, as if it were approaching the crest of a rounded hill:


A graph of its YoY growth rate shows that indeed the rate of growth has slowed to the point where for the last year, the rate of YoY advance has meandered generally between 0% and 5%:


Here's a close-up focusing on the last 13 months, smoothed to its monthly average better to show the trend:


In the past, this paltry a rate of growth has been a sign of either a recession or at very least a "growth recession."  Here's the YoY% change in the S&P 500 from 1958 through 1982:


And here it is from 1983 to the present:


Recessions have always been accompanied by negative YoY stock market returns.  Zero to 5% growth has sometimes been a harbinger of recession, but just as often - for example, 1966, 1984, 1994, and 1998 - has been associated with periods of slow growth or financial distress.

The present period of poor growth has existed for 11 months, showing that this is a more serious concern than during the 2010 "double-dip" panic.

Morning Market Analysis


Both the Brazilian market (top chart) and Chinese market (bottom chart) have broken through resistance.  The Brazilian market recently made the move; also note the rising short term EMAs (the 10 and 20 day) and that prices are above all the shorter EMAs.  Also note the rising MACD and positive CMF.  The Chinese market is right at the 200 day EMA.   The 10 and 20 day EMAs have moved through the 50 day EMA and the CMF is positive.


The junk bond market is still in the middle of a multi-year rally.  All the EMA are moving higher and momentum is positive.  This move is to be expected, as the yields on treasuries are so low.


It looks like the industrial metals market is trying to bottom.  We see a bottom around the 17.25/17.50 area and a descending top connecting the highs established in July.  Also note the narrowing Bollinger Band numbers for July, indicating that volatility is dropping.


Oil bottomed at the end of June/beginning of July and has been rising since.  Prices first hit the 200 day EMA in mid-July and is now rallying to that number again.  The shorter EMAs have moved through the 50 day EMA.

Wednesday, August 8, 2012

Can Global Growth Be Saved?

Yesterday, I noted that every region in the world is being hit by a growth slowdown.  The BRIC model of growth is producing diminishing returns, Europe is mired in what I believe to be their version of the US Constitutional Crisis and the US is dealing with the after-effects of a debt-deflation, economy wide credit bust.  Today, I want to address what can be done about this -- if anything.  Let me answer this by addressing the US' problems, followed by Asia's and than Europe's.

The US issues are actually fairly easy to deal with.  Standard macro states that in the event of a credit bubble burst, counter-cyclical federal spending is in order.  This will not be a new thought to readers of this blog, but it does need repeating as the "leaders" in Washington (and I use that term very liberally) are mired in their own stupidity.  The US has several advantages right now: ultra-low government bond rates, a high level of blue collar unemployment and a massively out-of-date and dilapidated infrastructure.  As one example of the latter, the Washington Post recently ran a story called, "Aging Power Grid on Overload As US Demands More Electricity," which noted:

The United States doesn’t yet face the critical shortage of power that has left more than 600 million people in India without electricity this week

But the U.S. grid is aging and stretched to capacity. More often the victim of decrepitude than the forces of nature, it is beginning to falter. Experts fear failures that caused blackouts in New York, Boston and San Diego may become more common as the voracious demand for power continues to grow. They say it will take a multibillion-dollar investment to avoid them.

“I like to think of our grid much like a water system, and basically all of our pipes are at full pressure now,” said Otto J. Lynch, vice president of Wisconsin-based Power Line Systems, “and if one of our pipes bursts and we have to shut off that line, that just increases the pressure on our remaining pipes until another one bursts, and next thing you know, we’re in a catastrophic run and we have to shut the whole water system down.”

As I've noted on more than one occasion, the American Society of Civil Engineers has given the US infrastructure a grade of "D."  You also might want to watch a program called, The Crumbling of America, which ran on the History Channel, which highlights the infrastructure problems we face.

Right now the US can borrow at record low rates (the markets are, in fact, basically asking as to take their money), rebuild its infrastructure, hire a ton of unemployed manufacturing and construction workers and rekindle demand.  We can also rehire a large number of teachers, police officers and other public servants who provide services we all extol but are seldom willing to pay for.

The Asian problem can initially be dealt with through a round of interest rate cuts.  Consider the following levels of benchmark rates from around the region:


As the blog Money Illusions has noted in the past, the Australian central bank has been far more prone to lower rates in anticipation of coming problems, rather than waiting for the economy to falter and then act.  I believe both China and South Korea also fall into that category -- banks that will and have demonstrated a proclivity to proactively manage and direct monetary policy to "lean against the wind."  None of these economies are in terrible shape: China's latest Y/O/Y percentage change in GDP growth was 7.6%, Australia's was 4.3%, Taiwan's was -.16% and South Korea's was 2.4%.  However, all are slowing and need an additional push which lower interest rates should help to accomplish.

The above problems are actually pretty easy to deal with -- at least for those of us writing on a blog.  In practical matters, they are harder to implement because the powers that be are typically pretty useless.  Now we move to the more intractable problems.

Two BRIC countries -- India and Russia -- face pretty daunting political problems that may be impossible to overcome.  India's political system is mired in a level of gridlock and graft, as noted by the Economist:

But India's slowdown is due mainly to problems at home and has been looming for a while. The state is borrowing too much, crowding out private firms and keeping inflation high. It has not passed a big reform for years. Graft, confusion and red tape have infuriated domestic businesses and harmed investment. A high-handed view of foreign investors has made a big current-account deficit harder to finance, and the rupee has plunged.


Russia has a different problem.  As recently noted by Barry Ritholtz over at the Big Picture Blog, (I'm paraphrasing here), there is no population in the world that has been more screwed over than the Russians, first by the Czars, than the communists and finally the mob.  Russia was lucky in the fact that they had oil, which helped them to grow with the other BRICs.  But needed reforms in the area of property rights and corruption have not been forthcoming.  The country has grown since the recession, but at far slower rates (between 3.8% and 5) than their BRIC brethren.  Until they pass and implement meaningful reform, they may fall back to their previous status as a country that really should do better, but can't.

China and Brazil are in an interesting situation.  Both have seen tremendous growth over the last 10-20 years.  But that growth is now petering out.  Part of the reason for the slowdown is the overall global slowdown: China supplies manufactured goods to the developed world, while Brazil supplies raw materials to China.  When the developed world slows, the demand for both country's goods understandably drops.  But both also face an overall slowing growth rate, largely because of their own success; both countries now have a middle class (which was the primary object of their growth spurts) but both also face a slowing growth curve as the middle class now wants to spend a bit of its savings and enjoy its leisure.  The growth of the middle class also means that international labor arbitrage is less likely to be used by corporations in moving to these countries.  In addition, as China shifts to a more consumer driven economy, commodity exporters like Russia and Brazil will have lower demand for their goods.

In short, it's distinctly possible that the era of the fast growing BRICs is simply over.  The situation is explained very well in this video from the Economist:

While other countries are now taking up the rapid growth mantel (Turkey, Columbia, Peru and Vietnam) these countries are simply too small to meaningfully impact world growth.  

And finally, there is Europe.  I previously noted that Europe is currently in a situation akin to the US under the Articles of Confederation.  We have a group a states who have created a liberalized trading code between themselves, but who also lack enough centralized authority to meaningfully implement effective macro level policy.  The Greek situation is a great example of this problem.  Greece has been fiscally reckless for some time (as in years); their budgetary policies were usually in violation of some EU covenant.  However, the central EU authority didn't have the requisite political power to stop Greece from enacting policies that violated EU dictates.  So, the only way to actually solve the problem occurred when Greece was ready to default on its debt.  Also consider the policy problem faced by the ECB; they have to set interest rate policy for strong countries like Germany and weak countries like Greece and Spain.  In short, it's an insane proposition from a policy implementation perspective.

The EU needs to implement it's own version of the US' constitutional convention.  They need to establish a new series and set of responsibilities and relationships between the central government and the individual countries.  And this will mean the individual countries ceding a certain about of power to the central government.  There is no other way for the group to survive without it.

In making this call, the primary objection would be that the convention could lead to a break-up of the union, which could lead to a world-wide recession or depression.  I would have to concede that point on a theoretical level but not a practical.  The union has already been in place for over 15 year; institutions and norms have already been developed and implemented.  Integration has already taken place on numerous levels which can't be undone.  In short, the union has come too far to stop now. 

To sum up, we have the following propositions.

1.) The US needs to engage in infrastructure spending.  Although easily conceived, practically impossible to implement considering the political players involved.

2.) The BRICs are no longer the source of massive global growth.  While a lowering of interest rates in each region would help to mitigate the overall slown all the countries are experiencing, the basic model of growth in these countries is fundamentally changing.  China is changing to a consumer led economic model, which is lowering its demand for commodities, thereby lowering the growth rate of other BRICs.  More intractable problems in Russia, India and Brazil further hinder the possibility of a return to rapid growth.

3.) The EU has serious structural problems that need to be overcome.  While their integration has come too far to be undone, the continent may lack the overall political will to meaningfully solve their problems in the short or medium term.

Put another way, muddling growth is probably here to stay for awhile.


Share

Twitter Delicious Facebook Digg Stumbleupon Favorites More