logo

Monday, October 31, 2011

GDP Contributions


The above chart simply shows last quarter GDP growth rate and the component parts of the GDP equation that contributed to growth.  PCEs were strong as was gross private domestic investment.  Also consider that inventory adjustments subtracted a full percentage point from the above total; had that number printed a "0" we would have seen growth of 3.5%.

Chicago Fed President Offers Intriguing Policy Idea

From the Chicago Fed


I believe that we can substantially ease the public’s concern that monetary policy will become restrictive in the near to medium term and, hence, reduce the restraint in expanding economic activity. This can be done by clearly spelling out in our policy statements the conditionality of our dual mandate responsibilities. What should such a statement look like? I think we should consider committing to keep short-term rates at zero until either the unemployment rate goes below 7 percent or the outlook for inflation over the medium term goes above 3 percent. Such policies should enable us to make progress toward our mandated goals. But if this progress is too slow, then we should move forward with increased purchases of longer-term securities. We might even consider a regime in which we reevaluate our progress toward our policy goals and the rate of purchase of such assets at every FOMC meeting.


Right now the Fed is in a policy quandary:  rates are already as low as they can go, yet unemployment is still about 9%.  While I believe that food inflation is a bigger issue than the Fed seems to, the Fed does not appear to be concerned about inflationary pressures.  Yet, the economy is still stuck in second gear, so the Fed governors are looking for some type of new policy idea.  Hence, we're seeing trial balloons such as the one above being floated.


Let me note several aspects to this policy conditionality. As I just said, I subscribe to a 2 percent target for inflation over the long run. However, given how badly we are doing on our employment mandate, we need to be willing to take a risk on inflation going modestly higher in the short run if that is a consequence of polices aimed at lowering unemployment. With regard to the inflation marker, we have already experienced unduly low inflation of 1 percent; so against an objective of 2 percent, 3 percent inflation would be an equivalent policy loss to what we have already experienced. On the unemployment marker, a decline to 7 percent would be quite helpful. However, weighed against a conservative estimate for the natural rate of unemployment of 6 percent, it still represents a substantial policy loss. Indeed, weighed against a less conservative long-run estimate of the natural rate, it is a larger policy loss than that from 3 percent inflation. Accordingly, these triggers remain quite conservatively tilted in favor of disciplined inflation performance over enhanced growth and employment, and it would not be unreasonable to consider an even lower unemployment threshold before starting policy tightening.


Here, the Fed president is laying out how he arrived at carious targets.  7% unemployment would still be a "policy loss" even considering that the new natural rate of unemployment (the lowest possible level unemployment could go) is higher.  In addition, the 3% inflation rate would still be a policy loss, even considering we've seen fairly tame inflation numbers over the last few years (the economy was on the verge of massive deflation during the recession).  Agree or disagree, it's good that he's laid out his thinking on the subject.


I would also highlight that while I believe that optimal policy would be consistent with inflation running above our 2 percent target for some time, this policy does not abandon the 2 percent target for long-run inflation. Indeed, I would support combining this policy with a formal statement of 2 percent as our longer-run inflation target in conjunction with reaffirming our commitment to flexible inflation-targeting. Furthermore, I see a 3 percent inflation threshold as a safeguard against inflation running too high for too long and thus unhinging longer-run inflation expectations. It also is a safeguard against the kinds of policy errors we made in the 1970s. If potential output is indeed lower and the natural rate of unemployment higher than I currently think, then resource pressures would emerge and actual inflation and the outlook for inflation over the medium term would rise faster than expected. If this outlook for inflation hit 3 percent before the unemployment rate falls to 7 percent, then we would begin to tighten policy.


I understand that some may find such a policy proposal to be hard to understand, or even risky. But these are not ordinary times — we are in the aftermath of a financial crisis with massive output gaps, with stubborn debt overhangs and high degrees of household and business caution that are weighing on economic activity. As Ken Rogoff wrote in a recent piece in the Financial Times, “Any inflation above 2 percent may seem anathema to those who still remember the anti-inflation wars of the 1970s and 1980s, but a once-in-75-year crisis calls for outside-the-box measures.”[9] The Fed has done a good deal of thinking out of the box over the past four years. I think it is time to do some more.

Here, the Fed president is acknowledging the current economic environment requires extraordinary measures, or more outside the box thinking.  Hence, changing the Fed's goals -- or telegraphing explicit policy goals -- is not inconsistent with economic expectations that would occur in a more "normal" economic environment. 

Overall, this is a very interesting plan.

China Says "Not Yet"

Despite European hopes and spin that the Chinese will bailout Europe, by funding a large part of the EFSF, China is not rushing to write Europe a cheque.

Klaus Regling, went to Beijing to discuss terms. However, his poorly planned, uninvited visit and the comments of Nicolas Sarkozy about Beijing having a "major role to play" in proposals to expand the European Financial Stability Facility (EFSF) only seem to have irritated the Chinese.

China, quite rightly, wants more clarity on terms and conditions etc before it considers investing anything.

The official Xinhua news agency said that Europe must put its house in order:

"China can neither take up the role as a saviour to the Europeans, nor provide a 'cure' for the European malaise.Obviously, it is up to European countries themselves to tackle their financial problems."

Europe needs to understand that it is a "buyers' market", and that it is up to the Europeans to "sell" their "investment opportunity" (EFSF) to potential investors.

Morning Market


This week I wanted to start with copper.  Over the last month it has formed a double bottom on strong volume and has now reversed from that into a counter-rally.  Prices are now above the 50 day EMA and have ample space to run.  This is a very encouraging chart, especially considering copper's overall economic importance.


On the 5-minute chart, notice the SPYs price action can be broken down into several sub areas, with the first one between 119 and 123, the second between 122.5 and 125.5 and the third between 126.5 and 129.5.  This is a good, healthy development as it allows prices to advance and then "catch their breath."


On the daily chart we see prices are still in a strong upswing.  Prices are above the 200 day EMA and all the shorter EMAs are moving higher.  The 10 day EMA has crossed over the 200 and the 20 day EMA has crossed over the 50.  As noted in the preceding chart, prices are advancing and then halting their upward move.  Ideally, we'd like to see prices move a bit lower right now, finding support at the 10 day EMA.  This would allow some traders to take some profits and allow others to get in a at a solid entrance point.


On the flip side of the risk spectrum are Treasuries, which are in a clear sell-off.  The long-end of the market is now below the 50 day EMA, with the 10 and 20 day EMAs moving lower.  Ideally, we'd like to see a small rally to force a small amount of short covering and let other shorts enter the market.

I would expect this week to be composed of "breathers," with equities moving a bit lower and Treasuries moving a bit higher.  But both of these moves would be considered counter-rallies to the overall general trend, which is definitely risk on. 


Saturday, October 29, 2011

Weekly indicators: gasoline usage plummets edition

- by New Deal democrat

In the rear view mirror, 3Q GDP increased 2.5%. The primary difference from the last two poor quarters was that government consumption did not actually contract. In monthly reports, September's durable goods orders decreased but was considerably better than expected, as were "core capital goods" which have now, like real GDP, exceeded their pre-recession peak. Personal income just barely rose, but spending was up a strong 0.6%. New home sales also exceeded expectations, and the Case-Shiller report once again remained above its March lows With both residential and nonresidential investment actually making positive contributions to GDP last quarter, the quarterly, monthly, and weekly data (as discussed below) all suggestthat housing sales as well as prices may actually have put in their bottom. On the other hand, consumer confidence plummeted further to a low last seen during the worst part of the "great recession."

The high frequency weekly indicators were generally good this week, with the singular and stunning exception of gasoline usage.

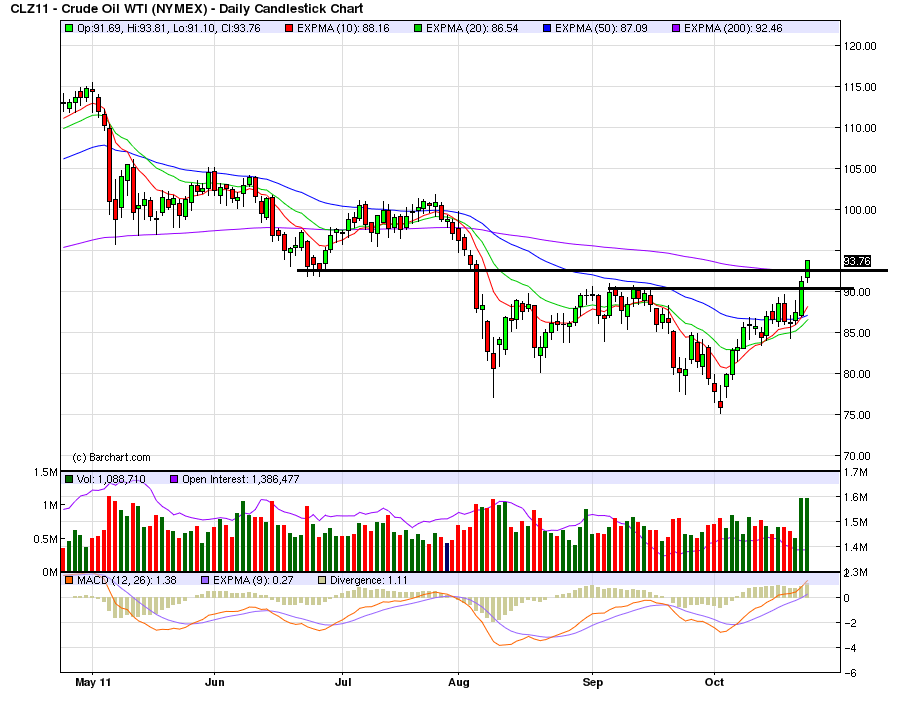
Oil finished near $94 a barrel on Thursday. This is at its recession-trigger level. It is extremely concerning that just a few days of good economic news causes oil prices to rocket right back to their choke collar point. Gas at the pump declined $.02 to $3.46 a gallon. Measured this way, we probably are still about $.20 above the 2008 recession trigger level. Gasoline usage plummeted -9.2% YoY, at 8501 M gallons vs. 9358 M a year ago. This reading of gasoline usage has in recent years only occurred in the dead of winter, and is the biggest YoY% decrease in at least the last 4 years. This is an absolutely huge decline measured both ways. Bill McBride a/k/a Calculated Risk believes it may just be noise, but if so it is one helluva thunderclap. Bill suggests using a 4 or even 10 week moving average. Even so, another reading next week like the last two weeks (last week was similarly low, and dpwn -3.3% YoY) would give us a strong warning on a 4 week basis. This week may be telling us that consumers have permanently altered their gasoline usage habits towards more conservation.

All three jobs-related indicators improved in the last week. The BLS reported that Initial jobless claims fell 1,000 to 402,000. The four week average increased to 405,500. With the exception of 8 weeks at the beginning of spring, the four week average remains close to its best reading in over 3 years.

The American Staffing Association Index rose to 91 last week. In the last couple of months, this series has resumed its upward trajectory, but remains lower YoY.

Tax withholding also improved. Adjusting +1.07% due to the 2011 tax compromise, the Daily Treasury Statement showed that for the first 17 days of October, $117.5 B was collected vs. $115.3 a year ago. For the last 20 days, $134.2 B was collected vs. $126.8 B a year ago. This breaks the string of actual negative readings from the last month.

Housing had a another reasonably good week. The Mortgage Bankers' Association reported that seasonally adjusted purchase mortgage applications decreased 6.4% last week. On a YoY basis, purchase applications were down -2.7%. This is back in the range that purchases mortgage applications have had been in for the 15 months beofre September. Refinancing increased 4.4% w/w. Refinancing has been very volatile and affected by small changes in interest rates.

Meanwhile, YoY weekly median asking house prices from 54 metropolitan areas at Housing Tracker showed that the asking prices declined only -0.7% YoY. Like almost every single week for the last couple of months, this is yet another record smallest YoY decline in the 5 1/2 year history of this series. The areas with YoY% increases in price increased by one to 17. The areas with double-digit YoY% declines remained at only 2. Nationwide asking prices may turn YoY positive within the next month.

Turning to money supply, M1 declined -0.3% for the week. It remains up 2.0% m/m, and 20.7% YoY, so Real M1 was up 16.8%.
M2 rose 0.1% w/w. It remained up 0.6% m/m, and 10.3% YoY, so Real M2 was up 6.4%. The YoY increase in both M1 and M2 nevertheless continue near historic high levels. It will be interesting to see what happens to these two series in the next several weeks, as a gauge of confidence as to whether the Euro situation is truly on its way to being solved.

Retail same store sales were tepidly positive. The ICSC reported that same store sales for the week of October 22 increased 2.4% YoY, while decreasing -0.8% week over week. Shoppertrak reported that YoY sales rose 2.7% YoY and were down -1.5% week over week.

Weekly BAA commercial bond rates decreased .11% to 5.41%. Yields on 10 year treasury bonds also decreased .02% to 2.20%. This is the third week in a row of decreasing spreads between the two rates, a good sign.

The American Association of Railroads reported that total carloads increased 1.5% YoY, up about 8300 carloads YoY to 547,300. Intermodal traffic (a proxy for imports and exports) was up 9800 carloads, or 4.2% YoY. The remaining baseline plus cyclical traffic declined 1500 carloads or -0.6% YoY. Total rail traffic has improved in the last month after having turned negative for 6 of 12 weeks during the summer.

With the exception of gasoline usage, this was probably the best week for the high frequency indicators in over 3 months. Unfortunately, if the positive economic news continues, I expect that Oil choke collar to be applied again almost immediately.

Have a nice weekend.

Friday, October 28, 2011

The Republican Keynesians

This is incredibly funny.  From the party that says government doesn't create jobs and that government spending doesn't help the economy:
It took months of fighting — the threat of a government shutdown, the graver threat of a default on the national debt, and now a new threat of major, automatic cuts to Medicare and defense programs — but Congress’ deficit obsession has finally exposed the rarest of all species: Republican Keynesians.With just a under a month until the deficit Super Committee must recommend policies that cut the 10 year deficit by $1.2 trillion, members of the Republican party — the same party that’s been on the war path for deep spending cuts, and that decries President Obama’s “failed stimulus” — are making uncharacteristic arguments against slashing spending. Trim too much, too quickly, they warn, and people will lose their jobs!

Call them Defense Keynesians — GOP members who represent defense interests, veterans, service members, contractors, and others whose livelihoods would be impacted by deep cuts to defense spending. They don’t want the Super Committee to cut much more, if any, from defense, and they certainly don’t want to pull the so-called “trigger” which would cut defense across the board by about $600 billion starting in 2013, if the panel gridlocks.

In testimony before the Super Committee on September 13, CBO director Doug Elmendorf cautioned members that deep, quick cuts to government spending of all kinds would harm the feeble economic recovery, perhaps severely. Late in the hearing, as if reading from the General Theory, Sen. Jon Kyl (R-AZ) drew the obvious corollary: “[T]hat’s true of defense spending as much as other spending. Is that not correct?” he asked

“It’s true of potentially all types of spending,” Elmendorf said. “There may be differences across types. But I think that’s a more subtle distinction.”

Kyl went on, “And here, with defense, for example, you’ve got high unemployment of returning veterans to begin with. You have reduction in end strength. You’ve got more people potentially unemployed. You got people making radios and building ships and so on. And if those cuts, therefore, end up reducing the employment in those industries and the amount of money spent in those areas, obviously it could delay economic recovery.”

“Yes, that’s right, Senator,” Elmendorf responded.

Thank you,” said Kyl.


The irony is too rich

So Much for the Double Dip Talk

From the BEA:
Real gross domestic product -- the output of goods and services produced by labor and property located in the United States -- increased at an annual rate of 2.5 percent in the third quarter of 2011 (that is, from the second quarter to the third quarter) according to the "advance" estimate released by the Bureau of Economic Analysis. In the second quarter, real GDP increased 1.3 percent.
Yesterday, SilverOz (not NDD, sorry) took a preliminary look at the numbers and concluded
I just wanted to take a quick look at Q3 2011 GDP, which I think is actually a bit better (the internals) than what the headline shows. The advance headline of up 2.5% was in line with expectations and is generally speaking a less than stellar number, but the breakdown may be a bit more promising.
I agree

First, consumer spending is back, increasing 2.4%,  But the best part of the number was the 4.1% increase in durable goods purchases.  This tells us that -- despite low morale -- consumers are buying bigger ticket items.  Service purchases -- which have been a big reason for the continued increase in PCEs -- also increased at a 3% clip.

Non-residential investment increased at a 16.3% clip -- a very healthy pace.  Equipment and software expenditures increased 17.4% -- indicating that businesses are more than willing to invest in their own infrastructure.  And non-residential structural investment increased at a 13.3% rate -- another strong improvement.  

Exports -- which have been a driver of the expansion, increased at a 4% rate while imports increased at a 1.9% rate. 

As NDD pointed out, had it not been for a contraction in private inventories, the overall growth rate would have been over 3% (inventory adjustments subtracted a little over 1% from the overall growth rate).

I'll be looking at this data in more detail all next week, but for now, the number and the internals are pretty encouraging.  

Morning Market

Over the last few weeks, I've been hesitant about the risk on trade.  No more.  Yesterday we say a strong break-out in equities in conjunction with a sell-off in the Treasury markets -- where we finally saw some volume increases on the sell-off.  The reasons for this rally were: the EU coming to some type of agreement and the US printing a decent GDP number.


The DIAs -- which are already above the 200 day EMA, gapped higher.  The 10 day EMA has crossed the 200 day EMA and the 20 is about to follow suit.


The SPYs also gapped higher yesterday.  The shorter EMAs are bullishly aligned and we had a bump up in volume as well.

The IWMs have more of a ways to go.  While prices are now over the 200 day EMA, the shorter EMAs have yet to cross.  Given recent price action, they probably will in the near future, but we're not there yet.  However, note the nice volume bump yesterday.

Notice we have three averages bullishly aligned.  In addition,


both the 7-10 year and 20 year plus treasury market finally moved lower on a nice volume bump.

Short version: equities are rising and the sell-off in the  Treasury market is gaining steam. 

Where's The Money Hunny?

Despite all the hoopla exuded by the Eurozone "leaders" over their "plan" to save the Euro, there are quite a few nagging questions over the details of that "plan".

Not least, the elephant in the room, where is the money coming from?

Klaus Regling, the head of the eurozone bail-out fund, has popped over to China today to try to twist some arms there.

Good luck with that then, as China has already indicated it will only put money in via an IMF backed scheme. Note, the IMF cannot put money into the EFSF.

In other news, Italian bond yields have risen today above 6%, in the event they reach 7% then it's game over.

Meanwhile in Greece, where the country's pension funds have been cut in half by the rescue "plan", the people marked National Day by forcing state officials to leave the parades by hurling eggs, yogurts, raising banners with Swastikas proclaiming "No to 4th Reich" and chanting “Thieves!”

This video shows students marchingin Athens, and raising their hands holding black handkerchiefs.


Whatever the hype and spin from the Eurozone bunker, the decisions made by the "leaders" of the Eurozone have had, and are having, very real and unpleasant consequences for the people of Europe.

Thursday, October 27, 2011

The Beige Book, Part V; Real Estate

From the Beige Book:


All twelve Districts reported that real estate and construction activity was little changed on balance from the prior report. Residential construction remained at low levels, particularly for single-family homes. That said, Philadelphia, Cleveland, and Minneapolis noted small increases in single-family construction, and construction of multifamily dwellings continued to increase at a moderate pace in Boston, Philadelphia, Cleveland, Kansas City, Dallas, and San Francisco. Home sales remained weak overall, and home prices were reported to be either flat or declining across all of the Districts. In contrast, rental demand continued to rise in a number of Districts. Commercial real estate conditions remained weak overall, although commercial construction increased at a slow pace in most Districts. Boston, Philadelphia, St. Louis and Cleveland cited some gains in demand for construction of education, healthcare, and institutional-related buildings, and New York reported an increase in hotel development. Furthermore, Philadelphia, Cleveland, and Chicago noted an increase in demand for manufacturing and distribution facilities. Vacancy rates remained elevated, but Boston, Atlanta, Chicago, Minneapolis and Dallas reported an increase in leasing activity and Philadelphia and San Francisco indicated rising investor interest in well-leased office space.


Nothing of a surprise here; real estate is still in terrible shape.  The good news is that it can't fall much further, which, in my opinion, seriously prevents another serious economic contraction.

All of the charts below are from the website Calculated Risk.


The overall pace of new home sales is still near multi-decade lows. 


However, the months of available supply appears to be in line with historical norms.


The pace of existing home sales is still centered around the 5 million/year figrure, where, despite the distortions caused by the housing credit issue, it's been for the last years.


The number of existing homes on the market is still elevated, but it has been slowly moving lower over the past few years.

Real estate is still in a terrible place.  However, it can't get much worse, which is actually good news.

Europe Agrees to Greek Debt Deal

From the NY Times


European leaders, in a significant step toward resolving the euro zone financial crisis, early Thursday morning obtained an agreement from banks to take a 50 percent loss on the face value of their Greek debt.
.....

The leaders agreed on Wednesday on a plan to force the Continent’s banks to raise new capital to insulate them from potential sovereign debt defaults. But there was little detail on how the Europeans would enlarge their bailout fund to achieve their goal of $1.4 trillion to better protect Italy and Spain.

After all the buildup to this summit meeting, failure here would have been a disaster. While the plan to require banks to raise new capital was generally approved without difficulty — banks will be forced to raise about $150 billion to protect themselves against losses on loans to shaky countries like Greece and Portugal — the negotiations over the Greek debt were difficult.
.....
In what the leaders saw as an important first step, banks would be required under the recapitalization plan to raise $147 billion by the end of June — enough to increase their holdings of safe assets to 9 percent of their total capital. That percentage is regarded as crucial to assure investors of the banks’ financial health, given their large portfolios of sovereign debt.
.....
The overall euro deal under discussion is complicated, weaving together the efforts to restructure Greek debt, increase the capital of Europe’s banks and expand the bailout fund so that it can ward off a financial panic in Italy — the euro zone’s third-largest economy — as well as in the relatively small economies of Greece and Portugal. Attention has focused on Italy because its government seems incapable of responding to the crisis, which has undermined the markets’ faith in Europe’s capacity to solve its problems.

A Quick Look at Q3 GDP

I just wanted to take a quick look at Q3 2011 GDP, which I think is actually a bit better (the internals) than what the headline shows. The advance headline of up 2.5% was in line with expectations and is generally speaking a less than stellar number, but the breakdown may be a bit more promising.

First, private inventories subtracted a full 1.08 percent from the total (ie with inventory levels unchanged, we would have seen a 3.5% print on headline GDP). This decline in inventories is unlikely to persist (provided we stay out of recession) into the next few quarters. Second, the numbers for private investment are starting to heat up. Fixed private investment added 1.6 points to GDP and the change from the preceding quarter was up 13% for structures and 17% for equipment and software from Q2 (which was also positive). So while we may not be seeing job creation, it is hard to say that businesses are tentative about making investments now. Third, while I doubt that government is going to be adding much to GDP in the near future, we may be seeing the losses slow somewhat (a breakeven for this Q in total and only down .16 for state and local). Finally, after being a huge drag for what seems like ever, it looks as though residential investment as a component of GDP has finally bottomed, which should further stop the bleeding.

Now all we need is for some of that increased private investment to start leading to greater job creation numbers.

The Eurozone Agreement

After much pantomime and farce, there has been agreement of sorts on a way forward to try to save the Eurozone from collapse.

The key points are:

- Banks will take a 50% "haircut" on Greek debt

- The bailout fund will be leveraged to Euro1Trillion

- Banks have 6 months to raise Euro106BN

So, will this work?

It has bought some time. However, the Eurozone (in its current) form will eventually implode because of its inherent internal contradictions (eg you cannot have one monetary policy when there is such a disparity of growth between the member states).

That being said, there are some "issues" that may well unravel this sooner than the "leaders" of the Eurozone would like:

1 The "haircut" is, despite the spin (seemingly, according to the Euro spin machine the "haircut" is voluntary, therefore it is not a default!), a default.

Does this matter?

Yes, it does matter.

By defining it as not a default, the Eurozone has null and voided sovereign hedging via CDS (this has not gone down well with those who hedged against default).

2 According to George Osborne, the IMF cannot contribute to the bailout fund.

Therefore where will the money come from?

Seemingly Sarkozy is on the phone to China (as I write this) trying to persuade them to put money in.

Good luck with that then!

3 Many commentators are of the view that the fund (even if money is found to beef it up) is not large enough to appease the markets.

4 A large part of the Greek debt being "haircut" is tied up with Greek pension funds, ie the value of Greek pensions has been halved. Quite what the views of the Greek people will be, when they realise that their financial future has been cut in half is anyone's guess!

Real people are being affected by the decisions made by the clowns "leading" the Eurozone, the clowns would do well to remember that they only remain in office under the sufferance of the people.

Morning Market


The SPYs rally continues.  Notice there are now two price clusters (see arrows) where -- after rising -- prices have consolidated their gains using the 110 day EMA as technical support.  The EMA picture continues to be positive and the last two days have seen a small bump in volume.  UPside resistance is a it below 126 while support is coming from the 200 and 10 day EMA.


Interestingly enough, the IEFs have not fallen from their center of gravity at the 50 day EMA.  Instead, prices and the EMAs have formed a "barbed wire" situation where the candles and prices are caught in an inter-twining situation.  Support is right around the 125.25 area -- a move below there in combination with a move higher in equities would confirm the equity's rally.


Corn is still in a fairly wide trading range/consolidation pattern between 600 and 800.  What's interesting to note is that while other commodities took a big hit during the risk off trade of the last few months, corn didn't move lower, indicating there is still a very tight supply and demand issue.


In contract, soy beans -- which were in a trading range between 1250 and 1450 -- recently fell below that range with 1250 not becoming resistance for this market. 

Wednesday, October 26, 2011

The Beige Book , Part IV; Lending

From the Beige Book:
Financial activity was reported to have weakened some since the last report. Dallas noted that the improvement in financial conditions had stalled, and Chicago indicated a further tightening of credit conditions, particularly for financial firms. In addition, New York reported noticeably weaker activity in the securities industry. Loan volumes were either flat or down slightly in most Districts. Consumer loan demand moved lower according to respondents in Cleveland, Chicago, and Kansas City, and it held steady in New York and San Francisco. However, New York, Philadelphia, Cleveland, Richmond, Chicago, and Kansas City all noted an increase in mortgage refinancing activity given lower mortgage rates and Cleveland also noted continued strength in auto lending and increased demand for business loans. Meanwhile, business loan demand was described as down somewhat in Philadelphia, Chicago, St. Louis, and Kansas City and was little changed in most other Districts. Loan standards were described as still tight for many classes of borrowers. That said, several Districts indicated that strong competition among banks for high quality borrowers was leading to lower rates and fees for these customers.
The latest lending survey from the Fed was released in July, so it's a bit out of date with the above data.

Let's take a look at FRED data:


Total loans and leases has been floundering for the duration of the latest expansion, indicating that credit expansion is not taking place in any meaningful way.


Commercial and industrial loans are not to blame, as this category has turned around from its drop.


 Ignore the bump at the beginning of the expansion which is a technical bounce.  Consumer lending is still weak.


Total real estate lending is dropping as well.

The above data indicate that credit expansion is weak at best, telling us the economy is definitely in a liquidity trap.

Greedy Bastards!

MEPs have just voted for a 5.2% increase in the 2012 EU budget.

The collapse of consumer confidence continues

- by New Deal democrat

Yesterday the Conference Board reported the lowest level of consumer confidence since March 2009.

This mirrors what I have been seeing in the daily Gallup consumer sentiment poll. Here is that poll since January 2008 (confidence is the dark green line):


Note the sharp loss of confidence at the time of the autumn 2008 financial collapse, and the even more sudden increase in early 2009. Specifically, sentiment sprang off its bottom at the same time as the stock market did, in the first week of March 2009 (just after the passage of Obama's stimulus package), rising sharply into May 2009. Sentiment stayed roughly even until the July debt debacle, when it collapsed right back down to its 2008 lows. Since that time it has bounced a little off the bottom, but is nowhere near to its pre-July levels.

This is an anomalous finding, seemingly a far more profound loss than the recent raw economic data justifies. Indeed, it appears to represent a Loss of Hope in the current political and economic status quo. If there is any silver lining, it is that this loss may be what finally galvanized the collective action of the Occupy Wall Street movement, which by the way I thoroughly support.

Draft Statement of EU Heads of State

Pathetic!

Source 

DRAFT STATEMENT OF EU HEADS OF STATE OR GOVERNMENT

At today's meeting, in line with paragraph 7 of the European Council conclusions of23 October concerning relations between the EU and the Euro area, the members of the European Council were informed by President Van Rompuy about the state of preparations of the Euro Summit that will take place later in the day.


They welcomed the consensus proposal on measures to restore confidence in the banking sector reached by the Council (ECOFIN) on 22 October. On this basis, they agreed the text annexed to this statement. The measures indicated in this text form part of a broader package, alongside the decisions taken by today's meeting of the EuroSummit. The Council will adopt the necessary follow up measures.


ANNEX


Consensus on banking package
1. Measures for restoring confidence in the banking sector (banking package) are urgently needed and are necessary in the context of strengthening prudential control of the EU banking sector. These measures should address:
a.
The need to ensure the medium-term funding of banks, in order to avoid a credit crunch and to safeguard the flow of credit to the real economy, and to coordinate measures to achieve this.
b.
The need to enhance the quality and quantity of capital of banks to withstand shocks and to demonstrate this enhancement in a reliable and harmonised way.
Term funding
2.
Guarantees on bank liabilities would be required to provide more direct suppo11 for banks in accessing term funding (Sho11-term funding being available at the ECB and relevant national central banks), where appropriate. This is also an essential part of the strategy to limit deleveraging actions.
3.
A simple repetition of the 2008 experience with full national discretion in the setting-up of liquidity schemes may not provide a satisfactory solution under current market conditions. Therefore a truly coordinated approach at EU-level is needed regarding entry criteria, pricing and conditions. The Commission should urgently explore together with the EBA, EIB, ECB the options for achieving this objective and report to the EFC.
Capitalisation of banks
4.
Capital target: There is broad agreement on requiring a significantly higher capital ratio of 9 % of the highest quality capital and after accounting for market valuation of sovereign debt exposures, both as of 30 September 2011, to create a temporary buffer. This quantitative capital target will have to be attained by 30 June 2012, based on plans agreed with national supervisors and coordinated by EBA. This prudent valuation would not affect the relevant financial repo11ing rules. National supervisory authorities, under the auspices of the EBA, must ensure that banks' plans to strengthen capital do not lead to excessive deleveraging, including maintaining the credit flow to the real economy or undue pressure on sovereign debt markets.
5.
Financing of capital increase: Banks should first use private sources of capital, including through restructuring and conversion of debt to equity instruments. Banks should be subject to constraints regarding the distribution of dividends and bonus payments until the target has been attained. If necessary, national governments should provide support, and if this support is not available, recapitalisation should be funded via a loan from the EFSF in the case of Eurozone countries.
State Aid
6. Any form of public support, whether at a national or ED-level, will be subject to the conditionality of the current special state aid crisis framework, which the Commission has indicated will be applied with the necessary proportionality in view of the systemic character of the crisis.

Another Day, Another Crisis in The Eurozone

Another day of rumour, tension and dashed hopes in the ongoing farce that is the Eurozone crisis.

Today Eurozone "leaders" are meeting in Brussels, to allegedly hammer out a rescue package for Greece and the beleaguered Eurozone.

Tensions are running high, not least because it is apparent that only in the last week have the "leaders" bothered to look closely at the figures required to save the Eurozone. Seemingly they got quite a shock.

In Greece the Finance Minister, Evangelos Venizelos, has finally got around to presenting Greek bankers with a plan for a 50% write down in debts (something that has been known about for several weeks). The real resistance to any write down is coming from French bankers, therefore I wonder when he will be making his presentation to them?

In the Bundestag Chancellor Merkel has told fellow MPs that Greece "needs permanent monitoring".

That will go down well in Syntagma Square!

Meanwhile rumours abound that the chief clown of Italy (Berlusconi) has done a deal with the Northern League that he will resign by year end, in exchange for their support of an increase in retirement age.

That's nice, the question is will the Italian people accept that?

Unsurprisingly the IMF is a "tad fed up" with the ongoing circus and wants to see a resolution. As such it is expected to take matter into its own hands in the not very distant future, as and when the circus in Brussels fails to achieve anything tangible.

It is going to be a long day!

As our "leaders" continue to make fools of themselves and create havoc in the markets, they may care to remember that this ongoing farce, the outcome of their decisions and the promises that they make is having/will have a direct impact on the lives of the millions of people living and working within the EU.

Morning Market


Yesterday, we say the equity markets retreat a bit.  The 5-minute charts shows prices retreating to the technically important level of 123, while the daily chart shows prices pulling back to just below the 200 day EMA.  This is a standard sell-off situation and should not be interpreted as a break in the upward trend yet.  Instead, we see traders taking some profits off the table as they wait to see how the upcoming news shakes out.


At the same time, we see Treasury prices rallying strongly, printing  a large bar, but on very weak volume.  Prices closed right above the 10 day EMA.  Again, this is not a trend reversal -- at least not yet, but instead a 1-day reaction to the equity sell-off.  The low volume indicates a lack of conviction on the part of traders to move into the treasury market in a big way.


After a late spring, early summer sell-off, cattle is nearing yearly highs again, largely because thin herds are lowering the number of cattle going to market.  This will lead to further upward pressure on food prices -- which are already moving higher at uncomfortable levels.


However, we may see a switch to pork, as prices there gapped lower severl times over the last two months.


Tuesday, October 25, 2011

Regulatory Uncertainty Isn't Causing High Unemployment

From the Treasury Department:


If regulation was a significant drag on business today, we would expect to see profits constrained after recent regulatory reforms were passed into law.  However, corporate profits as a share of gross domestic income have about recovered their pre-recession peak, and earnings per share in industries most affected by recent regulatory changes, such as energy and health care, have among the highest earnings per share of those in the S&P 500.  This growth is inconsistent with a corporate sector held back by regulation. 
.....
If regulatory uncertainty was the primary problem facing businesses, firms would prefer to use their existing capacity and current workers as much as possible, while avoiding building additional capacity until they are more certain about the contours of future regulation. 

Specifically, if demand was strong but businesses were concerned about future regulations, they would increase the hours of the workers they already employ rather than hiring additional workers.  We have seen no evidence of this in the data: the average work week for private employees has been roughly flat for the past year.  Similarly, if demand were strong, firms could easily expand using existing capacity without taking on the cost and risk of added capacity.  However, the share of total potential industrial output in use remains 3 percent below its long-run average.  Low capacity utilization is inconsistent with concerns about future regulatory risk, but aligns with weak demand holding back current production.

At the same time, business investment has led economic growth over the last few years.  Since the end of the first quarter of 2009, real investment in equipment and software has grown by 26 percent – about five times as fast as the economy as a whole.  However, businesses would not increase investment if they thought that future regulation posed a threat to their ability to operate profitably
.....
  • In the September survey of small business owners by the National Federation of Independent Businesses, more than twice as many respondents cited poor sales (29.6 percent) as their largest problem than cite regulation (13.9 percent).
  • In an August survey of economists by the National Association for Business Economics, 80 percent of respondents described the current regulatory environment as “good” for American businesses and the overall economy.
  • As noted above, in a recent Wall Street Journal survey of economists, 65 percent of respondents concluded that a lack demand, not government policy, was the main impediment to increased hiring.
  • According to data from the Bureau of Labor Statistics, less than three-tenths of 1 percent of mass lay-offs in the second quarter of this year were due to government regulations or intervention.

The Beige Book, Pt. II; Services

From the Beige Book:
Reports regarding nonfinancial services were mixed in September. Richmond noted slower overall activity, and St. Louis cited reduced demand for telecommunications, media, and education services. Demand for accounting and legal services was reported to have been unchanged in both Dallas and San Francisco. On the positive side, contacts in St. Louis reported that demand for business support services increased, and Boston reported strong business conditions for economic consulting firms involved with litigation work and advertising firms helping to market financial services. In addition, San Francisco noted continued growth in demand for technology services, Minneapolis noted an increase in activity in software and engineering, and Philadelphia cited some growth in logistics. Staffing at nonfinancial service-sector firms was reported to have been up slightly in Richmond, but growth slowed in Chicago and Philadelphia reported flat activity.
Like the manufacturing report, this seems to be a "two steps forward, one step back" summation.  Growth appeared to be reported in a small majority of districts, but the negative news weighed down the positive advances.

Let's take a look at the latest ISM index to corroborate some of the above data:
"The NMI registered 53 percent in September, 0.3 percentage point lower than the 53.3 percent registered in August, and indicating continued growth at a slightly slower rate in the non-manufacturing sector. The Non-Manufacturing Business Activity Index increased 1.5 percentage points to 57.1 percent, reflecting growth for the 26th consecutive month. The New Orders Index increased by 3.7 percentage points to 56.5 percent. The Employment Index decreased 2.9 percentage points to 48.7 percent, indicating contraction in employment after 12 consecutive months of growth. The Prices Index decreased 2.3 percentage points to 61.9 percent, indicating prices increased at a slower rate in September when compared to August. According to the NMI, nine non-manufacturing industries reported growth in September. Respondents' comments reflect an uncertainty about future business conditions and the direction of the economy."
Overall, the area is still just above the 50 line between growth and contraction.  New orders are up, but employment is down.
  • "Weak consumer confidence and high gas prices are placing downward pressure on retail sales volume." (Information)
  • "Business volume outlook and confidence across many market areas in North America appear to be softening." (Mining)
  • "It appears everyone is waiting to see what happens next. No trust in the economy or the federal government to do what is needed." (Accommodation & Food Services)
  • "The 2012 outlook is not optimistic; though we keep hoping for a rebound, we see little sign of an improved economy — nothing at least that will spur growth, investment or expansion. Improved investment performance in early 2011 caused us to begin several large capital projects, and although we have broken ground, we cannot help but question if our timing was right." (Educational Services)
  • "Third and fourth quarters appear to be slowing down in order volumes. Uncertainty over U.S. and European economy is causing clients to hold off on new orders." (Professional, Scientific & Technical Services)
  • "Negative forecast for housing market's future leads us to think we will be at current levels of business at best for the foreseeable future." (Wholesale Trade)
The overall tone of the anecdotal information from the report is one of a weakening outlook.  Lack of confidence on the part of both consumers and business is lowering current and future sentiment.  No one has any faith that things are going to get better in the near future.


The composite index has been hovering above 50 for the last 6 months, indicating this area of the economy is still expanding.


The business activity index is still above 50, and has risen a bit over the last three months.


New orders were fluctuating over 50 for the last three months, but last month they took a solid pop higher.  However, new orders did the same thing a few months back, only to fall back to lower levels.


The employment index has been dropping for the last three months and last month moved below 50 -- a sign of contraction.

The service sector appears to be in a slowdown phase, largely caused by lowered confidence and lack of economic visibility.


Morning Market


The above 10-day, 5 minute chart shows prices consolidating between 119 and 123; followed by their break-out on Friday and their continued move higher yesterday.  Also note how the range high of 123 became support for the break-out.


While prices have continued their break-out, I am still concerned about the lack of volume.  While no rally is ideal -- that is, it does not have all the expected hallmarks of an upward move -- the lack of volume is concerning.

Ideally, we'd like to see prices advance, fall back to technical support (the 200 day EMA) and then continue their move higher.


Both the medium and longer term Treasury markets are hanging on to the respective "center of gravity."  We're also not seeing a massive sell-off on higher volume totals.

The above charts show that the overall risk on trade is "on."


Oil has also moved through important technical resistance areas around the 90 and 93 handle.  Also note the shorter EMAs are moving higher, with the 10 having crossed the 50 day EMA and the 20 about to do so.  Day before yesterday oil printed a very strong bar, followed by yesterday's move higher -- which moved prices through the 200 day EMA.  The dollar's recent fall does not help matters, but this move higher is also part of the overall "risk on" trade.

A Continent of SPIVs - Kicking The Can Down The Road


Sir Mervyn King, governor of the Bank of England, is appearing before the Treasury Select Committee (TSC) today.

He has told them that he has little faith in whatever "plan" is agreed by the Eurozone "leaders" (aka "Clown College"). In his view, whatever is decided at tomorrow's EU summit will not solve the region's underlying problems; it will only buy one or two years of breathing space.

Quite!

In the unlikely event that Clown College can come up with a plan to "kick the can down the road" for a year or so, how will this be financed?

It seems that, as Europe is skint, they will be tapping the IMF (funded by the USA) for the money which will be provided via a Special Purpose Investment Vehicle - aka SPIV.

How very appropriate!

Now repeat after me, and learn this for prep:

- There is no plan
- There was no plan
- There will never be a plan

Monday, October 24, 2011

Repairing Infrastructure Can Help to Repair the Economy

From the Washington Post:


This sort of a program is in many ways vastly superior to the spending increases and tax cuts we saw in the American Recovery and Reinvestment Act of 2009. The limitation of most of the spending increases and tax cuts in the last rescue plan was that they were merely temporary fixes; they had no long-lasting effects. As long as the money flowed, they were stimulative; once the spending stopped, the stimulus stopped as well.

We still enjoy the benefits of the interstate highway system, which allows goods to be moved cheaply around the nation. Innovations at NASA led to many new products and industries, including innovations in the semiconductor, satellite and mobile computing sectors. And DARPAnet? You might recognize that as today’s Internet. All three are massive economic wealth generators, filling a role that is too long term and too expensive for the private sector.


Read the whole thing.


The Beige Book, Part II: Manufacturing

From the Beige Book:
Contacts indicated that manufacturing and transportation activity increased since the last report in most Districts. A large number of Districts reported higher production of autos and other transportation-related equipment. Cleveland, Atlanta, and Chicago noted increases in auto production, and Boston, Richmond, Chicago, and St. Louis all cited robust activity for auto suppliers. Dallas reported healthy demand for nondefense transportation goods. Boston, Richmond, Kansas City, and San Francisco indicated continued growth in commercial aviation and aerospace manufacturing. Steel production rose in Cleveland and Chicago, and in a number of Districts metal manufacturers' new orders also rose. Other areas of manufacturing were more mixed. The Dallas report noted a decline in refining activity. However, both Dallas and Atlanta continued to note robust oil and gas drilling activity, and this activity was said to be propelling demand for related equipment from suppliers in Chicago. Manufacturing of construction materials or equipment was reported to have increased some in Philadelphia, Chicago, and Dallas but remained weak in most other Districts. Growth in high-tech manufacturing continued to be robust in Boston, but moderated in Dallas and San Francisco. Respondents reported that food production was up in Chicago, Minneapolis, and San Francisco, steady in Dallas, and lower in Boston. Manufacturers of consumer products reported a softening in orders in Richmond, Chicago, and Dallas, while new orders for apparel increased in San Francisco.
The overall environment appears to be slightly positive.  Heavier goods -- autos, transportation, commercial aviation, steel and metals all rose, while construction equipment and consumer products were weaker.

To get more detail, let's first look at the latest ISM manufacturing report:
"The PMI registered 51.6 percent, an increase of 1 percentage point from August, indicating expansion in the manufacturing sector for the 26th consecutive month, at a slightly higher rate. The Production Index registered 51.2 percent, indicating a return to growth after contracting in August for the first time since May of 2009. The New Orders Index remained unchanged from August at 49.6 percent, indicating contraction for the third consecutive month. The Backlog of Orders Index decreased 4.5 percentage points to 41.5 percent, contracting for the fourth consecutive month and reaching its lowest level since April 2009, when it registered 40.5 percent. Comments from respondents generally reflect concern over the sluggish economy, political and policy uncertainty in Washington, and forecasts of ongoing high unemployment that will continue to put pressure on demand for manufactured products."


The overall composite index shows a drop in activity over the last 5 months.  But, note that overall activity has remained slightly positive.


The new orders index has been just slightly negative for the last three months, while


The production index turned slightly positive.

The anecdotal component of the latest report had the following observations
"The economy continues to be a drag on our business outlook. We are trying to deal with new and additional FDA regulations which are costing significant dollars. It is hard to recoup any of these additional costs in our pricing levels without losing significant sales volumes." (Chemical Products)

"Market is cautious, but still steady." (Electrical Equipment, Appliances & Components)

"Global demand for semiconductors is down and maybe not yet 'bottomed out.' Inventory reduction activities are a priority." (Computer & Electronic Products)

"Still strong automotive demand." (Fabricated Metal Products)

"Orders remain consistent and steady — no sign of lower demand." (Paper Products)

"Japan supply chain issues are over, but exchange rates and raw material prices are hurting our profit." (Transportation Equipment)

"We sense a weakening in demand, but it is not extreme at this point." (Plastics & Rubber Products)

"Overall, business is improving with a measurable uptick in orders this month. Part of that is due to pre-holiday season orders." (Miscellaneous Manufacturing)

"Business continues to be sluggish." (Furniture & Related Products)
 The overall tone of the comments is quite mixed.


Durable goods new orders continue to move higher, but they are still below the highs established in the previous expansion.  Over the last few months, I've expressed concern about this number, largely because of the stalling that occurred 6 months ago.  While that stalling is now over, I would still like to see more strength in this numbers series.

Let's move on to some of the regional indicators:

The Empire State Survey:
The Empire State Manufacturing Survey indicates that conditions for New York manufacturers continued to deteriorate in October. The general business conditions index remained negative and, at -8.5, was little changed. The new orders index hovered around zero, indicating that orders were flat, while the shipments index rose above zero to 5.3. The inventories index stayed below zero, a sign that inventories declined. The indexes for both prices paid and prices received fell, but remained positive, suggesting that price increases moderated. The index for number of employees rose several points but was at a relatively low level of 3.4, while the average workweek index was negative for a fifth consecutive month. The future general business conditions index dropped six points to 6.7, its lowest level since early 2009, while future indexes for prices paid and prices received declined.
This index has been right below 0 for the last three months, indicating slight contraction.  The good news is that it hasn't contracted any more sharply, but the bad news is it's still negative.

The Philly Fed Survey:
The survey’s broadest measure of manufacturing conditions, the diffusion index of current activity, increased from -17.5 in September to 8.7, the first positive reading in three months (see Chart). The current new orders index paralleled the rise in the general activity index, increasing 19 points and returning to positive territory. The shipments index also recorded a positive reading, increasing from -22.8 in September to 13.6 this month.Labor market conditions improved only slightly this month.

Nearly 18 percent of the firms reported an increase in employment, but 17 percent reported a decrease. The current employment index remained slightly positive but decreased 4 points from its reading in September. The average workweek index increased notably from -13.7 to 3.1. However, the percentage of firms reporting a longer workweek (15 percent) was only slightly greater than the percentage reporting a shorter one (12 percent).
This number had a nice pop the last month, pulling it into decently positive territory.

The Richmond Fed's survey:
In September, the seasonally adjusted composite index of manufacturing activity — our broadest measure of manufacturing — increased four points to −6 from August's reading of −10. Among the index's components, shipments gained fifteen points to −2, new orders dropped six points to finish at −17, and the jobs index moved up six points to 7.

Most other indicators also suggested more moderate weakness. The index for capacity utilization picked up three points to −11 and the backlogs of orders edged up two points to finish at −23. Additionally, the delivery times index added two points to end at −2, while our gauges for inventories were mixed in September. The raw materials inventories index was virtually unchanged at 18, while the finished goods inventory index gained five points to end at 22
These results are very similar to those for the Empire State survey; they are weaker, but slightly so.

Kansas City:
The month-over-month composite index was 6 in September, up from 3 in August and 3 in July (Tables 1 & 2, Chart). The composite index is anaverage of the production, new orders, employment, supplier delivery time, and raw materials inventory indexes. The increase was mainly
concentrated in durable goods plants, particularly for aircraft and computer equipment, while nondurable goods producers reported a continuedslowing in activity.

Most other month-over-month indexes also improved modestly in September. The production index rose from -2 to 3, and the shipments, new orders, and order backlog indexes also edged up. The employment index increased for the second straight month, but the new orders for exports index fell slightly after rising last month. Both inventory indexes increased somewhat.
These were slightly positive, but just barely so.

The Chicago Fed's index increased slighlty:
The Chicago Fed Midwest Manufacturing Index (CFMMI) increased 0.6% in August, to a seasonally adjusted level of 85.0 (2007 = 100). Revised data show the index increased 0.3% in July.
Again -- just a bare increase.

And finally, the Texas index saw a slight increase:
Texas factory activity increased in September, according to business executives responding to the Texas Manufacturing Outlook Survey. The production index, a key measure of state manufacturing conditions, rose from 1.1 to 5.9, suggesting growth picked up this month after stalling in August.

Most other measures of current manufacturing conditions also indicated growth in September. The new orders index edged down from 4.8 to 3.6 this month, suggesting order volumes continued to increase, but at a slightly decelerated pace. The shipments index rose from 6.7 to 9.4, reaching its highest level since March. The capacity utilization index remained in negative territory in September but rose from –2.8 to –1.3.

Perceptions of general business conditions worsened in September. The general business activity index remained negative for the fifth month in a row and fell from –11.4 to –14.4; 10 percent of manufacturers perceived an increase in activity this month, while one quarter noted a decrease. The company outlook index fell from 7.2 in August to a near-zero reading in September. Still, the great majority of respondents said their outlooks were unchanged or improved from last month.
The overall tenor of the manufacturing sector is one of slight strength or slight weakness, but essentially one where overall activity is fluctuating right around the "0" line.


Share

Twitter Delicious Facebook Digg Stumbleupon Favorites More