logo

Thursday, March 31, 2011

Is It About the Productivity -- Or is There Something More?

From the AP:

The United States is out of step with the rest of the world's richest industrialized nations: Its economy is growing faster than theirs but creating far fewer jobs.

The reason is U.S. workers have become so productive that it's harder for anyone without a job to get one.

Companies are producing and profiting more than when the recession began, despite fewer workers. They're hiring again, but not fast enough to replace most of the 7.5 million jobs lost since the recession began.

Measured in growth, the American economy has outperformed those of Britain, France, Germany, Italy and Japan — every Group of 7 developed nation except Canada, according to The Associated Press' new Global Economy Tracker, a quarterly analysis of 22 countries representing more than 80 percent of global output.

Yet the U.S. job market remains the group's weakest. U.S. employment bottomed and started growing again a year ago, but there are still 5.4 percent fewer American jobs than in December 2007. That's a much sharper drop than in any other G-7 country. The U.S. had the G-7's highest unemployment rate as of December.

Canada and Germany have actually added jobs since the recession ended in June 2009.

U.S. companies aren't acting the way economists had expected them to.

In the past, when the U.S. economy fell into recession, companies typically cut jobs but often kept more than they needed. Some might have felt protective of their staffs. Or they didn't want to risk losing skilled employees they'd need once business rebounded.

Among manufacturers, for example, some tended to hoard workers during downturns by giving them make-work assignments — sweeping factory floors, counting inventory, painting warehouses.

The result is that productivity — output per workers — has typically decelerated or even dropped as the economy has weakened.

Japan and Europe have been following that script. At the depth of the recession in 2009, productivity shrank 3.7 percent in Japan and 2.2 percent in Europe.

The United States has proved the exception. U.S. productivity growth doubled from 2008 to 2009, then doubled again in 2010, according to the Organization for Economic Cooperation and Development.

Panicked by the 2008 financial crisis and deepening recession, U.S. employers cut jobs pitilessly. They slashed an average of 780,000 jobs a month in the January-March quarter of 2009.

"My sense is there was much more weeding out of the weakest workers — the ones they didn't want," says Harvard economist Kenneth Rogoff.
This is something I've been mulling over for some time -- with no clear idea on the answer. During the worst part of the recession, companies were laying off over 600,000 people/month. Eventually, the economy lost more or less all the jobs created during the previous expansion. A rate of attrition that large would lead to the conclusion that companies cut too many employees and would need to hire them back quickly (at least, that's the intuitive logic).

Yet the exact opposite has happened. The pace of job creation has been at best lackluster; it's almost as though the US has cut off 10% of its workforce. Those still employed are OK, but those who are not are essentially locked out from getting back in. I think the article -- which notes that productivity gains in the US have been very large -- explains a very important fundamental reason: if you can do more with less, why hire more?

Consider the following chart, which shows five years of productivity gains in the US:


Notice the very large increase starting in 2009 -- increases which clearly outpaced the gains from 2006-2009. Despite the mass firings, the US became far more productive. In the above environment, businesses aren't in a position where they have to hire.

Let me add another wrinkle to this idea that I have not worked out in any detail. Consider this chart of the labor force participation rate:


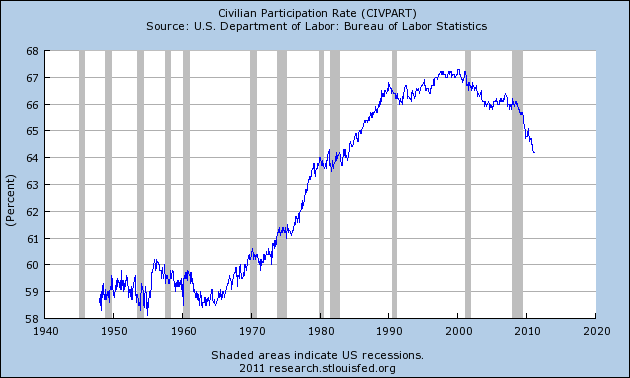
The participation rate measures "[t]he labor force as a percent of the civilian noninstitutional population." The chart above shows that number has been decreasing as the baby boomers start to retire. The boomer retirement has been a back story for some time; however, it's effect on employment decisions has not been measured that I know of. Now -- hypothetically -- let's assume that starting in roughly 2000 (or maybe earlier) those who were responsible for hiring decisions started to think to themselves, "with the upcoming baby boomer retirement coming, we need to be prepared for fewer job applicants. So, we need to be ready to make do with less." If that was the underlying premise of human resources for the last 15+ years, the lack luster, post recession employment situation would make more sense. In effect, US business was acknowledging the decreasing number of individuals available for work caused by the upcoming baby boomer retirement wave by increasing productivity and hiring fewer workers.

The Housing Bust updated: Lo and behold, supply and demand works!

-by New Deal democrat

A few months ago I had the temerity to ask: Is it time to start looking for the end of the housing bust? That's because, in talking about the housing market, it is important to differentiate between housing sales and housing prices. Housing sales have been bouncing along the bottom for over two years. Housing prices, after being temporarily propped up by the housing credit in 2009 and early 2010, have resumed their downward trajectory.

Why does it matter? So long as houses are being built for people who will actually live in them (as opposed to being flipped in real estate deals), increasing new home sales in particular are an unalloyed good. More homes being built means more construction employment, and more employment in all of the sectors of the economy that have to do with furnishing, landscaping, adding to and maintaining the home.

The renewed fall in housing prices is a much more nuanced proposition. Is that good or bad? That, dear reader, depends on whether you are a buyer or a seller. The simple fact is, the more house prices fall, the more potential buyers - especially first time buyers - are able to afford them. The more affordable houses become, the more get sold, eventually working through the overhang of inventory. And the sooner the overhang of inventory is sopped up, the sooner the new home building market can start to recover. While the high rate of unemployment and underemployment means that process is taking longer and is more painful than it should be, the fact is, the process is still taking place. In fact, as we will see, in at least one hard-hit metropolitan area, the price bottom may also already be in.

First, let's look at sales. Below is a graph of housing permits (blue) and new single home sales (red)(this latter series from the NAR):

Both of these plummeted by 75% from their peak at the end of 2005 until early 2009. With a mild temporary assist from the $8000 housing credit, permits have bounced along that bottom for two full years - but the 2009 bottom has held. Single family homes have gradually declined 5% more in the last two years. February set a new low for this latter series.

But before you leap to the conclusion that yet another leg down in sales may be starting, consider the following data from each series from the last 6 months, including averages for each of the three month periods:
Housing permits:
2010-09-01 547
2010-10-01 552
2010-11-01 544 (average 547)
2010-12-01 627
2011-01-01 563
2011-02-01 534 (average 575)

New home sales:
2010-09-01 317
2010-10-01 280
2010-11-01 286 (average 294)
2010-12-01 333
2011-01-01 301
2011-02-01 250 (average 295)

Why average over the three month period? Because for now, February's poor number simply looks like payback for the sudden, big upward jump in December. As commentary at that time noted:
While building permits surprised on the upside (big time) their jump was in large part attributable to a push by builders to get approval for dwellings ahead of changes in the building codes for California, Pennsylvania and New York (these have been in force since the start of 2011).

If March continues February's downtrend, maybe there is something more. Otherwise, the good news is, the bottom in housing sales is still in. The bad news is, there's no upward push whatsoever.

Now let's turn to housing prices. In real, inflation adjusted terms, the 10 and 20 city Case Schiller index of house prices is as low as it has been for 10 years:

This decline in housing prices, along with the decline in mortgage rates in the last few years, has meant that typical mortgage payments are now smaller as a share of household income than they have been in several decades:


Let me focus in on a couple of hard-hit metropolitan areas that were epicenters of the bubble and then of the bust: Phoenix, AZ and Fort Myers, FL. As in the past, I will be relying on data from Housing Tracker.net - the same data that allowed me to call the top in the housing market in real time in 2006. In 2005 at the height of the bubble, the median asking price for a house in Phoenix was $380,000. As of this month it is $145,000, as shown in this graph of the 25th (blue), 50th (green), and 75th (gold)percentile asking prices of houses in the Phoenix metro area:


Anyone who bought a house in Phoenix in the last eight years who is selling it now, is probably taking a bath - the house is worth less than they paid for it. But for a first time home buyer in particular, paying $145,000 as opposed to $380,000 is a miracle. And the asking price on the type of house first time buyers would be looking at - one at about the 25th percentile, has fallen from $259,000 in early 2006 to $85,000 now -- a 2/3 decline. Indeed, house prices in Arizona generally are now more affordable compared with median income than they have been in over a decade:

As a result, in the Phoenix area in particular, the housing inventory for sale, which peaked at 48,340 in November 2007, is now back down to 29,656. This is the lowest inventory in 5 years.


But I've saved the best for last. Let's now look at southwestern Florida (Fort Myers):

Just as in Phoenix, the number of listings has declined strongly since peaking in February 2008 at 22,335. As of March 2011 they are down to 12,646, the lowest in over 5 years:


And in this area, for the first time in five years, there is actually evidence that the bottom may already be in, as shown in this breakout of asking prices for the 25th, 50th, and 75th percentile listings:


Indeed, just yesterday Prof. Mark Perry noted that in February Las Vegas also recorded the highest number of home sales in over five years too.

As he summed up:
Isn't this evidence that markets are working? At some point, home prices fall far enough to start bringing buyers back into the market, and sales increase.


Indeed.

Yesterday's Market


The £300 EU Fee Per Head

The Office for National Statistics (ONS) claims that the British contribution to the EU increased from £5.3BN in 2009, to £9.2BN in 2010.

Every British taxpayer now pays the EU £300 per head per annum.

 The EU budget will rise by 2.9% this year, despite the fact that member states are having to make massive cut backs in their own budgets.

This dichotomy cannot contiue for much longer without there being a Europewide backlash against the EU.

Wednesday, March 30, 2011

State tax revenues for 4Q 2010 surprise to the upside

- by New Deal democrat

Calculated Risk tells us this morning that the Census Bureau reported quarterly state tax receipts for the 4th quarter of 2010 (fiscal 2Q 2011). As it turns out, they were a pleasant upside surprise compared with the preliminary Rockefeller Institute estimates.

I previously showed that only the April to June quarter (during which annual corporate and individual tax returns are most filed) shows a significant seasonal departure from the other quarters. A reasonable seasonal adjustment for this quarter to reduce it by 22.5%. Then all we have to do is adjust for inflation to create a record of "real" state revenues.

Below is an update trhough fiscal 2Q 2011 of quarterly state tax revenues. It records nominal state revenues and adjusts (in parentheses) *.775 for the April- June quarter beginning with the last fiscal year before the recession. In the second column I have further adjusted for inflation. The last quarter shows the relation of each quarter's revenues from the peak in revenue in the 4th quarter of fiscal 2008 (2nd calendar quarter of 2008) :
[apologies for the huge gap in the post - keep scrolling down. Every time I try to fix it, the html reverts to an older post]


Fiscal QuarterRevenues* ($ billions)Inflation- adjusted Revenues% off of peak
1Q 2008176.4183.8-1.5%
2Q 2008178.7183.6-1.6%
3Q 2008181.4184.6-1.1%
4Q 2008240.8 (186.6)186.60
1Q 2009181.2179.9-3.6%
2Q 2009171.4176.2-5.6%
3Q 2009159.2162.7-12.8%
4Q 2009200.4(155.3)157.3-15.7%
1Q 2010160.5161.5-13.5%
2Q 2010164.6164.7-11.7%
3Q 2010163.3163.0-12.6%
4Q 2010204.5(158.5)158.8-14.9%
1Q 2011168.1167.2-10.4%
2Q 2011(170.6p)177.8175.5-5.9%

(p)=preliminary, based on Rockefeller Institute report

When I originally posted this chart last month, I noted that "If the current trend ... continues, the Rockefeller Institute estimate of a shortfall of $60 Billion in FY 2011 compared with 2008 appears accurate."

With this revenue surprise, that estimate looks too pessimistic to me. Through the first two fiscal quarters, 2011's shortfall compared with 2008 is only $9.2B, and only $0.9B of that is from 2Q. While this quarter's GDP is likely to be only weakly positive, that is enough to believe that fiscal 3Q 2011 revenues will at least be in line with 2Q 2011 revenues. In other words, nominal FY 2011 state revenues may only have a shortfall of $10B-$20B, rather than $60B - and if we avoid another recession, nominal state revenue may have no shortfall at all compared with pre-recession revenues by the end of this summer.

While this is welcome good news, real state tax revenues will still lag pre-recession levels, and per-capita revenues still further (since to keep an even level, services must grow with population).

Are Transports Really Giving the Market A Good Signal?

The Reason There is No Pent-Up Consumer Demand

The following chart was printed on the Economists' Free Exchange Blog:


While consumers are spending, as shown in the chart above, there has been no sign of pent up demand. Real consumer spending on goods fell off its pre-2008 trend line during the recession and has since resumed its former pace with no indications that a surge in spending to make up for lost time is imminent.
(Mark Thoma also picked-up on this idea)

What the above statement does not explain is the reason for the upward sloping cure in consumer spending -- and, most importantly, whether it was sustainable -- which I would argue it wasn't. According to Census data, real median household income was stagnant for the first decade of the 2000's. Additionally, household debt continued to increase during that decade, eventually reaching over 130% of total DPI for U.S. households. That number (household debt/DPI) has been increasing for the last 30 years at a more or less constant pace. In other words, I believe the data indicates the pace of consumption was unsustainable, and was financed as much by debt financing as income growth. As such, the fall off caused by the recession was in fact a healthy and much needed correction in consumer behavior

My 2 cents (inflation adjusted).

Manufacturing -- Think Small

From the NY Times:

Think manufacturing, and most likely your brain defaults to abandoned factories, outsourcing and economically devastated regions like the Rust Belt. So strong is our tendency to focus on American manufacturing as something that’s been lost that a chorus has risen up to decry the prevalence of “ruin porn” — those aestheticized versions of the decidedly un-pretty, with a particular focus on the once-triumphant automotive center of the universe, Detroit.

But there are many parts of this country where manufacturing is very much alive, albeit in a different form. The monolithic industry model — steel, oil, lumber, cars — has evolved into something more nimble and diversified. As this country continues to figure out how to crawl out of its economic despair, we could benefit from focusing on the shift.

.....

Industries like the record business, publishing and technology are constantly evolving in order to survive. Both SFMade and its New York cousin, Made in N.Y.C., are increasingly able to share success stories of how manufacturing has developed new models for doing business in the 21st century. The monolithic single-industry model has evolved as manufacturers see the benefits of being smaller and paying attention to how patterns of consumption, ownership and use are shifting.

An example of this might be a company like Anchor Steam Brewery, which started as a saloon in San Francisco’s North Beach neighborhood in 1896. The scent of hops tells you you’re in the Potrero neighborhood, where they’re still brewing beer and producing small-batch bourbon. Today’s consumer, says Anchor’s Keith Greggor, “is much more likely to back the local guy.” Or there’s recent arrival Jamieson Leadbetter, a fourth-generation baker whose grandfather gave him this advice when he decided to continue the Portland, Me.-based family business in San Francisco: “Pick your community well. You’re not there solely to make money; you’re there to play a larger role.”

I realize it's internet chic to bemoan the loss of U.S. manufacturing. But the facts are that is just not the case.


Real Incomes Fall

The Office for National Statistics (ONS) reports that "real" incomes fell by 0.8% in 2010, from £14,181 per person to £13,980.

This is the first drop since 1981.

The fall, according to "experts", is due to salaries being eroded by inflation (something that the man in the street could have told the "experts" months ago).

The fall will add to the sense of gloom amongst consumers, and will inevitably hamper any possible growth in the economy.

However, as with all statistics provided by the ONS, these figures should be taken with a pinch of salt. Statistics from the ONS are always late, and invariably have to be adjusted some months after publication.

Yesterday's Market


Tuesday, March 29, 2011

Gold Still Hitting Resistance

From Bloomberg:

“The more positive signs from the U.S. economy mean that the expectations of rate rises are starting to come back to people’s attention,” Darren Heathcote, head of trading at Investec Bank (Australia) Ltd. in Sydney, said today by phone. Higher rates “will inevitably take some of the shine off gold, decreasing its attractiveness to investors,” he said.

Four Important Positive Changes in the U.S. Economy

There are three underlying trends occurring in the U.S. Economy that are flying below the radar.

1.) The increased savings rate: for the last 10-15 years, the cry of "we don't save enough" has been been heard throughout the economic world. It was argued (and I believe correctly so) that the lack of savings was a sign the U.S. consumer was borrowing too much (see number 2 below) and spending too much, essentially living beyond his means (which he was). However, that has clearly changed, as the U.S savings rate has now increased during the first part of the latest recovery:


This is an important fundamental change. It will help us to finance the trade deficit and keep interest rates lower by increasing the supply of loanable funds.

2.) The decrease in household leverage. This is tied in with point number one. US households are still heavily indebted. Before the recession started, the household debt/disposable personal income ratio was over 130%. That number has now dropped to 114%. As a result, the financial obligations ration has been dropping sharply:


3.) The rebirth of US manufacturing: According to the national manufacturing readings, US manufacturing is literally on fire. Consider this chart of the ISM manufacturing index:


The ISM number is printing some of the strongest readings in over 20 years. Kash over at the Streetlight Blog has written some great articles on this (see links at the bottom of the page on this link).

4.) The rise of US exports: the US is no longer the primary driving force of the the world economy; developing economies (especially the BRIC) players are exerting a strong influence over international economics. The US is selling exported goods into this strength, which is clealry helped by a cheaper dollar. This has led to the rise of U.S. exports as an important part of the economic recovery:

With housing and construction in the dumps and consumer spending pinched by thrift and tight credit, exports have powered nearly half of U.S. economic expansion since the recession ended in mid-2009

(The article goes on to note the U.S economy is now more vulnerable to international economic swings because of this development.)
There are still plenty of problems for us to deal with: a lackluster housing market and a high unemployment rate being at the top of the list. However, not all is bad; there have been some important fundamental changes for the better underneath the headlines.

And an oldie but a goodie -- I dug up this you tube video of me about two years ago talking about savings (I even mention Mish positively -- this was before he went off the reservation and into the great beyond):

New Congresspeople Now Members of the Washington Lobotomy Factory

From the Washingtonpost:

A breakdown late last week in closed-door negotiations between congressional leaders and the White House on funding the federal government makes it increasingly possible that Congress will not agree on a long-term funding resolution or another temporary measure by an April 8 deadline, aides from both parties said.

That means that the threat of a government shutdown — which had receded in recent weeks because of congressional approval of several stopgap funding measures — appears to be back on the table.

Problems with the negotiations became public late Friday, as revealed in comments from Sen. Charles E. Schumer (D-N.Y.) and the top three House Republican leaders. The apparent breakdown followed a Tuesday meeting among staff members for House Speaker John A. Boehner (R-Ohio) and Senate Majority Leader Harry M. Reid (D-Nev.) and representatives of the White House budget office on a possible deal for funding the government through the end of the fiscal year in September.

Democratic aides said talks had been underway for nearly two weeks between Boehner’s staff and the White House budget office, with steady progress leading to an agreement that the two sides would meet halfway between the $61 billion in cuts approved by the House and Democrats’ preference for maintaining current spending levels.

Just when you thought the idiots in Washington couldn't get any dumber, they rise to the occasion, as if to say, "we can actually do something that much dumber than what we have previously accomplished. No -- really. We can. Just watch us."

This is just idiotic. Government spending accounts for about 20% of US GDP. In addition, it is a facilitator of many important transactions. Shutting it down would be a huge shock to the economy --- at a time when we can ill afford it (as if there is a time when we can afford this lunacy). Here's something that people in Washington seem to forget on a regular basis: C+I+X+G = GDP. It's called the GDP equation. The "G" stands for government. Since the equation uses addition, taking out one of the primary variables will probably lower the total (unless one of the other variables increases sufficiently to make-up for the loss).

Let's look at some of the primary areas effected by such blatant stupidity:

The best guide for what consumers of government services can expect came in the last shutdown—the longest in U.S. history. After President Bill Clinton and a Republican Congress couldn't agree on spending, the government twice ran out of funding: from Nov. 14-19, 1995, and from Dec. 16, 1995 to Jan. 6, 1996.

About 285,000 federal employees were sent home without pay and a further 476,000 were forced to work without pay. Clinton said on Jan. 20, 1996, that the shutdowns had cost the federal government a total of $1.5 billion, or $2.1 billion in today's dollars—a number that does not include indirect costs. (The total nonmilitary federal workforce has fallen from 2.92 million at the end of 1995 to 2.84 million at the end of 2009, according to the U.S. Office of Personnel Management.) When the shutdowns ended, all employees had back salaries paid.

.....

• A shortage of federal funds eventually led 11 states and the District of Columbia to stop providing unemployment benefits when they couldn't or wouldn't fill the gap with their own funds. Other benefits were slowed or stopped entirely: Veterans stopped receiving some payments, including insurance death claims and checks for education provided by the GI Bill. Delays hit recipients of federal welfare programs and adoption-assistance services, along with children in foster care and in the Head Start early childhood program. The Bureau of Indian Affairs closed, cutting off assistance payments to 53,000 people, while about 25,000 American Indians also stopped receiving checks for oil and gas royalties.

.....

About 200,000 Americans were left waiting for new passports after the State Dept. stopped processing applications. Visa applications by foreigners were left unprocessed, stacking up at a rate of 20,000 to 30,000 per day.

• Government economic reports that investors watch closely were stopped. Reports that might be blacked out this time include the January trade balance on Mar. 10 and data on February housing starts and building permits, due out on Mar. 16.

• Work on 3,500 bankruptcy cases was suspended. About half the employees of the Small Business Administration were placed on furlough, leading to 260 small businesses not receiving loans each day, according to a White House summary written in January 1996.

• National parks, national forests, and other federal monuments and museums were shut. In January 1996, Bloomberg News reported that kayakers and rafters were cut off from the Colorado River because they couldn't get permits.

• While federally funded health care such as Medicare continued, the National Institutes of Health stopped accepting new patients in clinical research programs. The Centers for Disease Control halted surveillance of diseases such as HIV/AIDS and influenza.

• The government temporarily closed the Federal Parent Locator Service, which helps find parents who are delinquent in making child support payments.

And there's much more in this detailed report.

At a time when the phrase "self-sustaining recovery" is gaining traction and credence, the yahoos in Washington want to completely derail the recovery. Great.

Yesterday's Market


The Eurozone Crisis - Spain Is Next

All eyes have been focused on Portugal, Ireland and Greece as the Eurozone slowly unravels. However, spare a thought for the next in line for financial chaos namely Spain.

Banco Base (Spain's 3rd largest savings bank) has asked for Euro 1.45BN in state funds to meet "new local capital requirements".

The Euro, as it currently stands, is destined to fail. At best there may be a two speed Euro (split along a North South axis). At worst, the Euro will cease to exist.

Monday, March 28, 2011

Are Durable Goods Orders Showing an Upcoming Slowdown?


This chart is bothering me. Notice that a large number of data points in the last year are concentrated in the 192,000-196,000 area. There have been some strong moves above that area, but only three times. Now let's look at a longer time series.


On the longer scale, notice that durable goods orders are still far below their peaks from the end of the last expansion. In addition, note their rate of ascent appears to have stalled, which is revealed in more detail on the following chart:


Above is a chart of durable goods orders on a scale of 100. Notice that orders have stalled in the 75-80 range for the last 10 months -- which is below previous levels.

Durable goods orders are a very volatile series. However, their current lack of movement is beginning to concern me regarding the big picture.

The Week Ahead

Stocks: The rally over the last week or so has been very weak. Volume has been down and half of the upward moves occurred at the open with no intra-day follow through. The SPYs are still contained by a downward sloping trend line. However, the IWMs (which have led the market higher) have broken through their trend line but also have a declining MACD. While the underlying technical are still OK (for example, the MACD is about to give a buy signal on the SPY) the underlying economic situation (weakening durable goods orders, high gasoline prices, increasing agricultural prices) are concerning.

Bonds: The IEFs are in a clear downward trend for the last eight days. Prices are currently right at the 200 day EMA. The 10 and 20 day EMA are both moving lower, but the EMAs are in a tight bunch right around the 200 day EMA. Prices are right below a short-term trend line. Additionally, before the latest rally, prices were moving lower in a move that looked like a flight from safety to risk, which is a standard move at this point in the market cycle. The real question is has the negative fundamental news which rallied the bond market over the last few weeks ameliorated to the point where bond traders are comfortable selling bonds into the risk markets again?

The dollar: the UUP ETF is still in a confirmed downtrend and has been since the beginning of the year. All the "rallies" have been upward sloping pennant patterns that hit resistance at an EMA and then moved lower. The ETF has moved through the 22 price area, which was an area of major technical support and is now moving higher, probably to retest the 22 price area. In addition, the market widely expects the EU to raise interest rates before the Fed, making the Euro a more attractive bullish play.

Oil: Oil is consolidating in a triangle pattern. Right now, the primary question is which direction will prices break in.

Yesterday's Market


EU Pressures Portugal

The EU is putting pressure on Portugal to come cap in hand to the EU for a bailout.

Ewald Nowotny, a governing council member of the European Central Bank, is quoted in the Telegraph:

"From a purely economic point of view one could probably recommend it. The domestic political situation in Portugal has clearly worsened ... the head of the government has stepped down."

Why such advice?

Philanthropy?

No, this is purely self interest based on fear of the Eurozone unravelling as a result of economic chaos in Portugal. Were Portugal to accept a bailout, the people of Portugal would end up having to sacrifice their economic well being for the future of the Euro.

Is this something that they really want?

It is not just Portugal that threatens the Euro, Ireland will need further refinancing and Spain is looking decidedly unstable as well.

Friday, March 25, 2011

Weekly Indicators: Accumulating signs of a slowdown Edition

- by New Deal democrat

In the rear-view mirror department, 4th Quarter 2010 GDP was revised back up to 3.1%. Monthly data reported this week, however, was depressing. New home sales were recorded at an all-time low, although balanced against December's big uptick, the last three months are still better than the three months previous to them. More ominous, however, was the big decline in consumer confidence, and in particular expectations about the future. These are the worst in 2 years, and are a leading indicator. Durable goods also came in very weak. While this is a volatile indicator, over the last 6 months it has trended sideways. Did I mention that this is also a leading indicator? In short, Oil's choke collar is biting into the economy.

Turning now to the high-frequency weekly indicators:

The BLS reported that Initial jobless claims last week were 382,000. The 4 week average is 385,000. This is the fifth week in a row that this number has been initially reported below 400,000. This bodes well for the next payrolls report.

On the other hand, Oil was trading at about $105.65 a barrel Friday midday, the third full week it has been above $100. It remains at a level above 4% of GDP. There WILL be a significant economic damage and I believe we are now observing the start of that damage. Gas at the pump declined $0.01 last week to $3.56 a gallon. Gasoline usage again was slightly lower than last year. I expect this comparison to deteriorate so long as the oil price spike continues.

Railfax was up 5.7% YoY. Baseline traffic is now no higher than last year's levels, and cyclical traffic is only slightly higher. Waste materials are now below last year's levels. Shipments of motor vehicles, however, continued to improve YoY. Intermodal freight's rate of advance over last year declined last week. With the exception of motor vehicles, rail freight is now also signalling a significant slowdown.

The Mortgage Bankers' Association reported an increase of 2.7% in seasonally adjusted mortgage applications last week. This series has meandered generally in a flat range since last June. On the plus side, this is the longest time since 2006 that this series has gone without a major decline. Refinancing also increased another 2.7%, but despite that remains near its lows since last July.

The American Staffing Association Index remained at 91. This series has stalled at the 90-91 level for 6 weeks. It is signalling stagnation, not growth, and is stalled relative to its pre-recession peak.

The ICSC reported that same store sales for the week of March 19 rose 3.0% YoY, and decreased -0.1% week over week. Shoppertrak reported a 4.0% YoY gain for the week ending March 19, and a WoW gain of 3.9%. Unlike almost every other series, these two series' YoY comparisons have been improving over the last month.

Weekly BAA commercial bond rates declined -.10% to 5.98%. This compares with a -0.15% deline in the yields of 10 year treasuries to 3.29%. Both series are down from recent highs. This was the second week in which the relative move in corporate bonds signalled weakness.

M1 was unchanged w/w, up 0.5% M/M, but up a strong 9.0% YoY, so Real M1 is up 7.8%. M2 was down -0.3% w/w, up 0.3% M/M and up 4.6% YoY, so Real M2 is up 2.4%. M2 is back into the "yellow zone" below 2.5%, but M1 is still strongly in the "green zone" as it has been for several years.

Adjusting +1.07% due to the recent tax compromise, the Daily Treasury Statement showed that for the first 17 days of March, $135.5 B was collected vs. $134.6 B a year ago, for a gain of +0.6% YoY. For the last 20 days, $162.1 B was collected vs. $150.9 B a year ago, for a gain of $11.2 B, of over 7.4%. I suggest using this series with extra caution, because the adjustment for the withholding tax compromise is only a best guess, and may be significantly incorrect.

For the first time since mid-2010, the LEI may have a negative month in March. Consumer confidence, durable goods, and (Feb.) hosuing permits are all down strongly. The stock market and money supply look like they will record essentially neutral readings. Only the bond spread yield and initiall unemployment claims look like strong positives. It is worth noting, on the plus side, that ECRI's growth indicator continues to be positive, and they are not revising their forecast of continued growth. Neverthelss, as I said at the outset, it appears that the Oil choke collar is indeed beginning to constrict the economy.

Finally, the Census Bureau reported today that the Latino population has increased to 50.5 million people, or about 16% of the total US population. All of which make Los Estados Unidos the third most populous Latin American country after Brazil and Mexico (surpassing Argentina and Columbia). And on that note: Buen fin de semana!

4Q GDP Up 3.1%

From the BEA:

Real gross domestic product -- the output of goods and services produced by labor and property located in the United States -- increased at an annual rate of 3.1 percent in the fourth quarter of 2010, (that is, from the third quarter to the fourth quarter), according to the "third" estimate released by the Bureau of Economic Analysis. In the third quarter, real GDP increased 2.6 percent.

The GDP estimate released today is based on more complete source data than were available for the "second" estimate issued last month. In the second estimate, the increase in real GDP was 2.8 percent (see "Revisions" on page 3).

The increase in real GDP in the fourth quarter primarily reflected positive contributions from personal consumption expenditures (PCE), exports, and nonresidential fixed investment that were partly offset by negative contributions from private inventory investment and state and local government spending. Imports, which are a subtraction in the calculation of GDP, decreased.

The fourth-quarter acceleration in real GDP primarily reflected a sharp downturn in imports, an acceleration in PCE, an upturn in residential fixed investment, and an acceleration in exports that were partly offset by downturns in private inventory investment, in federal government spending, and in state and local government spending, and a deceleration in nonresidential fixed investment.

In general, this is a good report. The reasons for the increase were broad based -- investment, exports and PCEs added to growth. Imports dropped -- which is something we shouldn't count on this quarter. Also, several news stories noted that with high gasoline prices negatively impacting consumer sentiment, the 1Q number will probably be lower.

Is It Time For Another Home Buyer Tax Credit?

Recent news from the housing market has been extremely concerning. Existing home sales appear to have stabilized somewhat, but at a low level and new home sales hit a record low. Credit conditions for new homes are also tightening, further hampering the process. There is an overhang of foreclosed properties depressing prices. And finally, homeowners equity is low, indicating that getting people out of homes they can't afford will be much harder. Simply put, there are myriad number of reasons to consider helping the housing market in some form or another.

As such, we need to revamp the home buying tax credit. Will this "distort the market?" Yes. However, the market is already distorted to the low end, so consider this an equilibrium move. While some will argue we shouldn't use the tax code for this, I'll respond as a tax lawyer -- the code is littered with special interest tax giveaways. One that helps an ailing economic sector makes just as much sense. However, I would condition the credits phase out to something tied to the overall inventory of homes or months of available inventory number -- and, phase it out gradually; don't make it a "here today, gone tomorrow" affair.

Just my thoughts on the topic.

Yesterday's Market


Crisis? What Crisis?

Unsurprisingly, given the resignation of the Prime Minister (Jose Socrates) and the ongoing budget turmoil, Portugal has had its credit rating downgraded by Standard & Poor's to BBB and by Fitch to A-.

Despite the turmoil and the downgrade, the EU have delayed making a decision as to providing a "comprehensive package" to tackle the eurozone debt crisis.

Instead the EU has adopted the ostrich policy of sticking its head in the sand. Jean-Claude Trichet, President of the European Central Bank, said that Portugal must implement the fiscal austerity measures that Mr Socrates had proposed.

All very well, but it is precisely those austerity measures that were rejected along with Mr Socrates!

As ever, the EU displays a remarkable talent for being out of touch with reality.

Thursday, March 24, 2011

Declining Initial Jobless Claims suggest improving March jobs report

- by New Deal democrat

For the past few months, I have been running a scatter graph of initial jobless claims (left) and monthly jobs gained/lost (bottom) since jobless claims hit their peak in March 2009. Blue is all private jobs, red includes government jobs as well (except I have excluded the March through August 2010 period which was distorted by census hiring and firing):


As I have previously pointed out, there is a nearly linear relationship. So long as initial claims continue under 400,000, we should expect robust monthly jobs reports (with a very big +/-125,000 variance, however).

So, why an update on this issue now? The BLS conducts its survery during the week just before mid-month. The 4 week average of initial jobless claims now is about 15,000 less than it was 4 weeks ago, when over 200,000 private jobs were added to the economy. In short, subject to the huge variance desribed above, and keeping in mind that it will (probably) be described as "disappointing" at first, only to be revised higher in the ensuing two months, we can expect a pretty good March jobs report a week from tomorrow.

Texas Drought To Increase Wheat and Cattle Prices


The worst Texas drought in 44 years is damaging the state’s wheat crop and forcing ranchers to reduce cattle herds, as rising demand for U.S. food sends grain and meat prices higher.

Texas, the biggest U.S. cattle producer and second-largest winter-wheat grower, got just 4.7 inches (12 centimeters) of rain on average in the five months through February, the least for the period since 1967, State Climatologist John Nielsen- Gammon said. More than half the wheat fields and pastures were rated in poor or very poor condition on March 20.

Dry conditions extending to Oklahoma, Kansas and Colorado may cut crop yields in the U.S., the world’s largest exporter, as too much moisture threatens fields in North Dakota and in Canada. Wheat futures in Chicago are up 50 percent in the past year, after drought in Russia and floods in Australia hurt output and sent global food prices surging. Wholesale beef reached a record this week, and the U.S. cattle herd in January was the smallest since 1958.

.....

Parts of Texas, Oklahoma, Kansas and Colorado had less than 25 percent of normal precipitation in the past 30 days, National Weather Service data show. The region may get some help from storms beginning March 26, which may drop about a half an inch of rain, said Joel Widenor, a meteorologist at the Commodity Weather Group LLC in Bethesda, Maryland.

“In a lot of places, there’s very little moisture in the ground,” said Nielsen-Gammon, the state climatologist who also is a professor of atmospheric sciences at Texas A&M University in College Station. Low subsoil moisture “will make us very susceptible to drought this summer if we have extended patches of dry weather,” he said.


Someone Finally Notices the Declining Labor Force

From MarketBeat:

The Congressional Budget Office released a report today, projecting labor force participation through 2021. Labor force participation peaked in the late 1990s at around 67% as Baby Boomers reached peak working age and the entrance of women into the work force plateaued. It have been dropping since, with the decline exacerbated substantially by the recession as people dropped out of the labor force. The participation rate stood at 64.2% in February, down from 66% in December 2007 when the recession began. The CBO expects it to decline to 63% by 2021


This is something I noted last month in this post where I commented:

The participation rate increased from a little after 1960 until 2000 and then started to decrease. The question for this decrease is "why?"

There are two fundamental reasons. The first is that women as a percentage of the labor force increased and stagnated over the same time period. As women entered the workforce starting in the early 1960s the labor force participation rate (the percentage of the population either employed or unemployed) increased in sympathy. However, women as a percentage of the labor force plateaued in 2000 and dipped slightly thereafter, leading the labor force and therefore the participation ratio to decline.

Secondly, there is the issue of the baby boomers or "someone born during the demographic birth boom between 1946 and 1964.[9]" Someone born in 1946 would turn 60 in 2006 and be 65 in 2011. As these people have retired, they have left the labor force (they are neither employed or unemployed). Hence, we have the second reason for the decrease in the labor force participation rate -- retiring baby boomers.


This is an incredibly important development -- and one that I don't think people have fully accepted yet.

Here is a link to the CBOs report

The Wisdom of Socrates

Jose Socrates the Prime Minister of Portugal has "fallen on his sword", as a result of his austerity budget being voted down by all the opposition parties.

Socrates had stated, prior to the vote, that if the budget was defeated he would resign.

The result of this defeat is that the country probably has to stage a general election and, because it has no budget, will have to be propped up by the EU in order to prevent the financial collapse of Portugal and the unravelling of the Euro.

Socrates is a canny man, and has probably saved his country from an austerity package that would have cause chaos domestically.

Yesterday's Market


Share

Twitter Delicious Facebook Digg Stumbleupon Favorites More