logo

Wednesday, June 30, 2010

ADP Report Shows Weak Employment Market


From the FT:

US companies added a modest 13,000 jobs in June, as private-sector job growth stalled amid a wobbly economic recovery.

June hiring slowed dramatically from the previous month, when private companies added 57,000 workers, according to ADP Employer Services, signalling that private companies held back ahead of summer. The gain was much smaller than the 60,000 additional jobs that economists had expected.

.....

“The slow pace of improvement from February through June is consistent with other publicly available data, including a pause in the decline of initial unemployment claims that occurred during the winter months,ADP said in its report.


Consider this chart from the St. Louis Federal Reserve of the 4-week moving average of initial unemployment claims:


Notice how it has stalled for most of this year. This is why I've been concerned about the sideways movement for the last few months.

-----------------

New Deal democrat here. I wanted to add my thoughts to Bonddad's.

The ADP has had a horrible record predicting the Nonfarm Payrolls number of jobs for the last year and a half. Here's a list of how the ADP number (1st column) has compared with Nonfarm Payrolls non-government jobs number (2nd column) and the Household Employment Survey (3rd column) so far this year (all figures in thousands):

Jan. -22 +16 +541

Feb. -20 +62 +308

Mar. -23 +158 +264

Apr. +32 +218 +550

May +55 +41 -35

June +13 ? ?

That's nearly a 100,000 average difference between the ADP and BLS reports.

In other words, Friday's jobs report could stink -- but if it does, its correlation with ADP's report will, imho, be simple coincidence.

Consumer Confidence Decreases


From the Conference Board:

The Conference Board Consumer Confidence Index® which had been on the rise for three consecutive months, declined sharply in June. The Index now stands at 52.9 (1985=100), down from 62.7 in May. The Present Situation Index decreased to 25.5 from 29.8. The Expectations Index declined to 71.2 from 84.6 last month.

.....

Consumers’ appraisal of present-day conditions was less favorable in June. Those saying conditions are “good” decreased to 8.0 percent from 9.7 percent, while those saying business conditions are “bad” increased to 42.4 percent from 39.5 percent. Consumers’ assessment of the labor market was also less favorable. Those claiming jobs are “hard to get” increased to 44.8 percent from 43.9 percent, while those saying jobs are “plentiful” decreased to 4.3 percent from 4.6 percent.

Consumers’ short-term outlook, which had improved significantly last month, turned more pessimistic in June. Those anticipating an improvement in business conditions over the next six months decreased to 17.2 percent from 22.8 percent, while those expecting conditions will worsen rose to 14.9 percent from 11.9 percent.

Consumers were also much less optimistic about future job prospects. The percentage of consumers anticipating more jobs in the months ahead decreased to 16.0 percent from 20.2 percent, while those anticipating fewer jobs increased to 20.8 percent from 17.8 percent. The proportion of consumers anticipating an increase in their incomes declined to 10.6 percent from 11.4 percent.

Raise your hand if you're surprised by this development.

Seriously, the combination of Europe, market instability and unemployment took their toll last month.

Here's a chart of the data:


Notice that confidence has been depressed for the entire recovery and sits at levels just above those of the recession.

The Price of Austerity

From the NY Times:


In effect, policy makers are betting that the private sector can make up for the withdrawal of stimulus over the next couple of years. If they’re right, they will have made a head start on closing their enormous budget deficits. If they’re wrong, they may set off a vicious new cycle, in which public spending cuts weaken the world economy and beget new private spending cuts.

On Tuesday and Wednesday, pessimism seemed the better bet. Stocks fell around the world, with more steep drops in Asia Wednesday morning over worries about economic growth.

Longer term, though, it’s still impossible to know which prediction will turn out to be right. You can find good evidence to support either one.

The private sector in many rich countries has continued to grow at a fairly good clip in recent months. In the United States, wages, total hours worked, industrial production and corporate profits have all risen significantly. And unlike in the 1930s, developing countries are now big enough that their growth can lift other countries’ economies.

On the other hand, the most recent economic numbers have offered some reason for worry, and the coming fiscal tightening in this country won’t be much smaller than the 1930s version. From 1936 to 1938, when the Roosevelt administration believed that the Great Depression was largely over, tax increases and spending declines combined to equal 5 percent of gross domestic product.

Read the whole article.


Yesterday's Market

Let's start with the Treasury market, as it shows that concern is high.


While the short end of the Treasury curve has been higher, it is still very high, rallying and showing concern among traders. People are parking money in short-term securities out of concern for the economy.

The 7-10 year part of the curve is also showing a deep level of concern about the market and the economy. The last time we saw levels this high was the deep financial meltdown of 2008.


Yesterday, the TLTs broke through key resistance. They are approaching levels last seen at the height of the financial panic in 2008.

The Treasury market is signaling several things.

1.) Interest rates aren't increasing anytime soon.

2.) Deflation is a big concern

3.) There is tremendous concern about the economy and the stock market.


The transports are signaling more trouble ahead. After breaking through resistance (a), they rose a bit but then started falling hard a little over a week ago (b). Also note that yesterday prices gapped lower in a big way (c) and closed just below key levels.


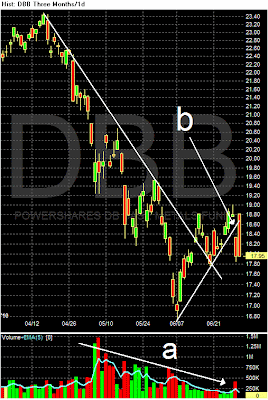
Yesterday, industrial metals moved lower, breaking key support (b). Note the move lower was a big gap lower.


Agricultural commodities also fell, gapping lower (a).


Oil also gapped lower (a), although the move lower was not of the same magnitude as the DBAs or DBBs.


In the equity markets, the indexes opened lower with a big gap down (a). The SPYs made lower lows (b, c and d) throughout the day. But notice that in general, prices meandered in a tight range for most of the day. The reason is the sharp drop at the open. Whenever prices drop like that, it's typical to see them move sideways for the rest of the day. Also note the rising MACD (e), indicating there was an momentum for most of the day.

Prat

"It was 7.45am on June 30 2009 when Steve Perkins a senior, longstanding broker for PVM Oil Futures was contacted by an admin clerk querying why he'd bought 7m barrels of crude in the middle of the night.

The 34-year old broker at first claimed he had spent the night trading alongside a client. But the story began to fall apart when he refused to put the customer in touch with his desk for official approval of the trades.

By 10am it emerged that Mr Perkins had single-handedly moved the global price of oil to an eight-month high during a "drunken blackout".....

The FSA will consider re-approving him as a broker after the ban, if he has recovered from his alcohol problem, but noted "Mr Perkins poses an extreme risk to the market when drunk"."

Source The Telegraph.

It is hardly surprising that the City and the financial services industry are held in such contempt, and despised, by the rest of the country.

Tuesday, June 29, 2010

Household Savings and Debt Service

- by New Deal democrat

In expansions, households are confident and are willing to take on more risk. As they lose confidence and retrench, a recession occurs. Typically this retrenchment goes on until the recovery is definitively established.

The Federal Reserve releases this information on a very lagged basis. On Friday they released household debt information for the first quarter of this year --January through March. It shows that households have continued to aggressively lower their debt and other financial burdens.

First, let's look at household debt obligations (mortgages, loans, credit card payments etc.):


This has fallen from 14% to 12.5% of disposable income -- lower than at any time in the last 10 years and almost halfway back to the lowest point since the series was started at the beginning of the Reagan presidency.

Now, here's the broader measure of financial obligations (including leases, tax and insurance payments, etc.):


This too has fallen over 1.5% and is also lower than than at any point in the last 10 years, and also represents nearly half the increased debt obligations households have taken on since 1980.

Yesterday the savings rate for May was also reported, rising slightly to 4%:


As Bonddad has noted in the last post, household disposable income has also increased nicely in the last several months. Real income has increased as well.

Put these together, and you have a picture of major improvements to household balance sheets -- more income (finally), more savings, and an aggressive paydown in debt. If households continue this pattern for two more years, they will have almost completely repaired their balance sheets to the point before the beginning of the Reagan economic era.

Three years ago I started writing about a "S l o w M o t i o n Bust" -- a nineteenth century style deflationary panic that would unfold over years instead of months, because of the deployment of the entire 20th century economic arsenal designed to avoid a Great Depression style deflationary spiral. While we are in recovery from the 2008 oil spike and financial panic, the "slow motion bust" isn't over because the structural problems remain. Where households are concerned, it looks like it will be another two years or more before their finances are repaired. (Note that this is a similar timeframe to when I suspect that housing prices will be near their bottom).

This is what happens during Kondtratieff winter.

Case Shiller Up


From Bloomberg:

Home prices in 20 U.S. cities rose in April from a year earlier as sales got a boost from a tax credit aimed at reviving the industry that triggered the worst recession since the 1930s.

The S&P/Case-Shiller index of property values climbed 3.8 percent from April 2009, the biggest year-over-year gain since September 2006, the group said today in New York. The increase exceeded the median forecast of economists surveyed by Bloomberg News.

The end of a government homebuyer incentive worth as much as $8,000, mounting foreclosures and unemployment near a 26-year high threaten to set real estate prices back following the stabilization that began earlier this year. Eroding home equity may limit household spending, the biggest part of the economy, even as gains in income help underpin demand.

Let's take a look at the data. Click on all images for a larger image:

The year over year number continues to improve

While the month to month number continues to stabilize.

Notice that last month only three cities had negative month to month numbers.

With the expiration of the tax credit comes a series of questions, especially about the sustainability of the price increases. Only time will tell.


PCEs and Income Up


From the BEA:

Personal income increased $53.7 billion, or 0.4 percent, and disposable personal income (DPI) increased $49.0 billion, or 0.4 percent, in May, according to the Bureau of Economic Analysis. Personal consumption expenditures (PCE) increased $24.4 billion, or 0.2 percent. In April, personal income increased $59.4 billion, or 0.5 percent, DPI increased $63.7 billion, or 0.6 percent, and PCE increased $1.4 billion, or less than 0.1 percent, based on revised estimates.


Let's look at the data:


Wages at service producing industries are in a clear uptrend, as are

Wages at goods producing industries.


Disposable personal income is also increasing.

Real PCEs are in a clear uptrend, as are

real service expenditures.
Non-durable goods purchases, however, appear to have stalled.


But purchases of durable goods is also increasing.

These figures point to an economy that continues to expand.

Banks on Life Support

The Bank for International Settlements (BIS) has warned that European banks are still "on life support", and that they need to "come clean" about their bad loans.

The Telegraph quotes the BIS annual report:

"Losses on European bank balance sheets are expected to mount over the next few years. Some banks are rolling over existing loans rather than inducing foreclosures, thus delaying loss recognition."

Rather bizarrely BIS then state that low interest rates and fiscal stimuli by governments is exacerbating matters, causing "moral hazard".

I would venture to suggest that were the rates and stimuli packages reversed, the slump caused would be far more detrimental to the economic health of Europe than the "moral hazard" issue.

I would also note that the low rates and fiscal stimuli do not in themselves cause banks to behave "immorally". Banks behave either "morally" or "immorally", depending on their culture and internal controls; to blame others for the failings of banks is shortsighted.

BIS do, correctly point out that Europe and the US are unlikely to be able afford to bail out the banks again, and that a Greek sovereign debt crisis is more than likely.

In view of this, to suggest that fiscal and monetary conditions should be tightened at the very time that the US and Europe are struggling to drag themselves out of recession is foolhardy in the extreme.

Yesterday's Market


From a macro-perspective, notice how all the averages prices are consolidating around the 200 day EMAs. This indicates that the markets are seriously conflicted about future movements -- are we in a bull or a bear market.


From an EMA picture, notice that short-term EMAs are clearly bearish -- all of them are moving lower and the shorter are below the longer. Most importantly, the 10 and 20 day EMA are below the 200 day EMA.


The daily chart shows that equity prices have moved in three segments over the last 10 days: a consolidation (a), a big drop (c) followed by more consolidation at lower levels (c).


With yesterday's price action, gold once again failed to move through the important resistance area of 122-123. This is the fourth time gold has had problems with this area.

For more on the Treasury market, see this post from Corey over at Afraid to Trade. he sums up that market really well.

Monday, June 28, 2010

Oh My God -- Sense From Washington

From the AP:

Hoyer warned in a speech prepared for delivery to the Center for Strategic and International Studies that "unsustainable debt has a long history of toppling world powers" and that China, as a major holder of US debt, could challenge US leadership.

Hoyer called for a "budget compromise" that would "restore our fiscal balance and health" and cited measures enacted by former presidents George Bush and Bill Clinton -- who both raised taxes to get US debt under control.

"And an agreement like that, to be implemented after the economy has fully recovered, is a necessity today," he said in his prepared remarks.

After we recover,

1.) Increase some taxes and

2.) Cut some spending

It's almost like he made sense ....

Chinese Window Dressing

From the Financial Times:

The Chinese central bank announced it would abandon its two-year peg to the US dollar a week ahead of Saturday’s G20 summit in Canada where the value of the renminbi had threatened to become one of the major issues.

Since then, the Chinese currency has risen by 0.5 per cent against the US dollar, a large movement in the context of the usually tightly controlled currency regime, but still only equivalent to the daily 0.5 per cent trading limit that has been in place for five years.

As a result, the Chinese delegation could yet come under pressure at the G20 summit to be more specific about what will change with the new currency policy.

“The rest of the [G20] were not born yesterday, and there may be some suspicion that the move over the last week was just window-dressing to take the exchange rate issue off the top of the agenda,” said Brian Jackson, a strategist at Royal Bank of Canada in Hong Kong. “To reduce the risk of trade tensions, we will need to see further renminbi gains in the days and weeks ahead.”

I used the word glacial to describe what would happen when China made this announcement.

I hold by that characterization.

Maufacturing hours and Nonfarm Payrolls

- by New Deal democrat

Here we are at Jobs Week again, with June nonfarm payrolls to be reported on Friday. As I noted at the end of last week, while the housing market, a big long leading indicator, is of great concern, payrolls are a coincident indicator, and I wouldn't expect them to turn simultaneously with leading indicators (although deflationary busts can come on quickly).

One short leading indicator for payrolls is average hours worked in manufacturing. It hasn't gotten the attention it has deserved, but as we will see, it has been on a tear, coming in at 41.5 hours in May.

How good a reading is that? Well, let's look at the last 60 years. Here is average hours worked in manufacturing (blue), with year over year change in payrolls (red), since 1950:


Notice that manufacturing hours were above 41.0 only a few times in the 1950s, and blew through to 42.0 hours at the peak of the housing boom.

But notice the job situation as well. On each of those occasions, manufacturing hours over 41.0 coincided or led by between 1 and 9 months, annual job growth of at least 2 million. Here's the actual data:

1950 0 months
1952 9 months
1955 2 months
1955 0 months
1964 1 month
1969 0 months

I haven't included the 1970s, because they stunk. At no point did factory hours worked meet or exceed 41.0 hours.

Now let's turn to the 1980s through the present.


Notice again that factory hours only meaningfully exceed 41.0 in the latter part of the 1980s, during much of the 1990s, and at the peak of the housing boom -- and now. In fact, the only time during this period that manufacturing hours were as high as 41.5 was as the "jobless recovery" of the early 1990s finally gave way to real growth, and during the tech boom.

Once again, during this time a reading over 41.0 for at least two months (note that in 1992, there was only one month in which factory hours just equalled 41.0 hours) coincided with or led annual job growth of 2 million jobs by 0 to 8 months. Again, here is the actual data:

1987 0 months
1992 n/a (one months 0f 41.0 only)
1993 5 months
2004 8 months
2005 0 months

Note, however, that manufacturing hours stayed strong right into 2008, while payrolls declined from +2 million jobs annually, to an actual loss year-over-year by the time manufacturing declined. It was only when the housing bust metasticised from construction and Wall Street into the general economy in late 2008 that manufacturing hours went down.

So, despite the strength in manufacturing -- strength which has only been equalled a few times in the post WW2 era -- mean a short return to 2 million jobs year over year, or will construction again make this an exception? Well, let's take a look at that collapse in construction jobs:


Over 2 million construction jobs -- more than 25% of the total -- have been lost since the housing bust began. On average about 50,000 construction jobs a month were lost from 2007 through 2009. Notice, however, that they have stabilized this year so far. (Note: construction jobs aren't broken down between commercial and residential in the statistics).

It certainly seems likely that there will be at least another brief spasm downward in construction jobs, given the stark decline in housing permits and starts, but probably nothing like the last few years.

In other words, while we may not hit 2 million plus jobs created year over year by the end of this year, it certainly looks like there is enough upward momentum to sustain job creation for at least a few more months, even if leading indicators have become at least temporarily more foreboding.

The Danger of Austerity

Last week, I noted that the lack of passage of the unemployment bill was, well, incredibly stupid. Today, Paul Krugman notes this stupidity as well.

In 2008 and 2009, it seemed as if we might have learned from history. Unlike their predecessors, who raised interest rates in the face of financial crisis, the current leaders of the Federal Reserve and the European Central Bank slashed rates and moved to support credit markets. Unlike governments of the past, which tried to balance budgets in the face of a plunging economy, today’s governments allowed deficits to rise. And better policies helped the world avoid complete collapse: the recession brought on by the financial crisis arguably ended last summer.


Right now the economy is benefiting from these policies. We've seen an increase in PCEs, retail sales, ISM indexes, regional Fed indexes, investment in equipment and software and exports. This has culminated in three quarters of GDP growth.

In short, we're at the beginning of a recovery. All we have to do is keep doing what we're doing.

However,

As far as rhetoric is concerned, the revival of the old-time religion is most evident in Europe, where officials seem to be getting their talking points from the collected speeches of Herbert Hoover, up to and including the claim that raising taxes and cutting spending will actually expand the economy, by improving business confidence. As a practical matter, however, America isn’t doing much better. The Fed seems aware of the deflationary risks — but what it proposes to do about these risks is, well, nothing. The Obama administration understands the dangers of premature fiscal austerity — but because Republicans and conservative Democrats in Congress won’t authorize additional aid to state governments, that austerity is coming anyway, in the form of budget cuts at the state and local levels.

Why the wrong turn in policy? The hard-liners often invoke the troubles facing Greece and other nations around the edges of Europe to justify their actions. And it’s true that bond investors have turned on governments with intractable deficits. But there is no evidence that short-run fiscal austerity in the face of a depressed economy reassures investors. On the contrary: Greece has agreed to harsh austerity, only to find its risk spreads growing ever wider; Ireland has imposed savage cuts in public spending, only to be treated by the markets as a worse risk than Spain, which has been far more reluctant to take the hard-liners’ medicine.

The continuation of the recovery is dependent on politicians doing the right thing. Last week's debate about unemployment benefits was without a doubt one of the most Kafkaesque events I have ever witnessed in my lifetime. Not since someone floated the idea that we can win a land war in Asia has Washington done something so mind-numbingly stupid.

What I find most disturbing is how incredibly stupid and ignorant Washington is about simple economics. I have posted the GDP equation several times to illustrate how incredibly ignorant the "government spending can't help" argument is; it is purely counter-factual and exists only in a the realm of political dogma. Yet that does not stop this incredibly idiotic argument from gaining traction in political dialog.

I don't think the situation is as dire as Krugman argues. He is prone to hyperbole. Most importantly, he is using his perch to make a political point in a language that drives people to action. I do think Washington has demonstrated beyond a shadow of a doubt that they are stupid beyond belief.

For me, the jury is still out. There are plenty of strong economic numbers out there still (see the ISM manufacturing and service numbers, regional Fed numbers, PCEs, real retail sales, etc..). however, last week was incredibly disappointing from a political perspective and indicates Washington lowers IQs and both political parties are filled with idiots.


G20 Flexibility

The low key G20 meeting in Canada produced a communique that took negotiators 45 hours to draft.

The final communique endorsed a flexible timeline for each country to build up higher levels of banking capital and liquidity.

The result may well be favourable to some countries. However, as the banks are now global players they will simply use this flexibility in their own interests and simply pick and choose their best options and best countries in which to operate from.

Sunday, June 27, 2010

Yesterday's Market


Let's start with the dollar. Note that prices have moved through key support (a) and that prices have also moved through the 50 day EMA (b). The 10 day EMA has moved below the 20 and both the 10 and 20 are heading lower (c).


While momentum has dropped (d), there hasn't been a huge move out of the market yet (e and f).

With a drop in the dollar, we've seen a rebound commodities:


Agricultural commodities have moved higher (a) and the EMA picture is the mirror image of the dollars with the 10 and 20 rising and the 10 moving through the 20 (b). While there is plenty of momentum (c) there isn't a lot of movement into the market yet (d and e).


Industrial commodities have moved through resistance as well (a), but not in as strong a manner as the agricultural commodities. In addition, the EMA picture is less bullish as none of the shorter EMA has moved over the longer EMAs (b). There is plenty of momentum (c) but again we aren't seeing a big move into the commodities yet (d and e).

The lack of meaningful participation in either the DBAs or DBBs (the lack of an increase in the A/D and CMF) indicates the recent rise in price is more of a reaction to the dollar's drop in price rather than a meaningful increase in bullish sentiment.


Starting with the SPYs, notice recent price action can break down into three areas. A strong rally, characterized by strong candles (a), a top with small candles (b) and then the sell-of last week that has strong downward moving candles (c).


Last week, the market was in a strong downtrend (a). Also note that prices continued to move through key support areas ((b, c and d) throughout the week.

And finally, consider this point about Treasury yields from Barron's:

THIS MARKET MOMENT, IT'S all about the bips. In trading-desk slang, bips means basis points, or hundredths of a percentage point, the elemental unit of measure for bond yields. And the most important bips of the past week, arguably, are the mere 65 of them that make up the yield on the two-year Treasury note.

This yield has been dragged lower by a series of weaker-than-anticipated economic readings on housing and a predictable (if not widely predicted) downgrade of the Fed's scoring of the recovery. The yield on the 10-year note, also in fast retreat to 3.11%, has tracked the U.S. economic data surprise index tick for tick.

.....

In case you've been trapped in the 1990s, note that stocks these days move in step with bond yields, both falling as economic worry and deflationary anxiety rises. Thus, last week's 3% drop in the Dow industrials, which brought the index toward the lower reaches of the trading range that has taunted, bedeviled and bored investors this year.

Bips can also serve as an acronym for Big Intractable Problems, the cable-news-ready messes that are quite clearly weighing on public psychology, from vexing fiscal issues at every level of Western government to the unstoppable oil spill to fractured loyalties among war commanders.

Friday, June 25, 2010

Weekend Mashup: Blondie and Jim Morrison

- by New Deal democrat

When I was a kid, I was a big fan of the Doors. I recently came across this mashup of Blondie's "Rhapsody" and Jim Morrison's vocals from "Riders on the Storm". So help me, this mix of the 1980s and 1960s actually works! Give it a listen:


See you on Monday.

Weekly Indicators: Good News and Really Bad News edition

- by New Deal democrat

First, the Really Bad News: the NAR reported that new home sales cratered, falling from 450K to 300K on an annualized basis. Meanwhile, existing home sales fell slightly from 5.79M to 5.66M on an annualized basis. They will crater in turn next month.

This bad news is only augmented by the MBA mortgage indexes for the week ending June 18. The Market Composite Index declined 5.9%, the Refinance Index declined 7.3% and the seasonally adjusted Purchase Index declined 1.2%, all compared with the previous week. by 1.0 percent. This index is back to its housing crash lows of 2 weeks ago. (Side note: a commenter asked me what I thought of ECRI's long leading index going negative. Since we know that the MBA index is part of ECRI's separate index - and apparently a fairly big part - this tells us that if mortgage applications don't improve, we will have a double-dip, at least for one quarter. It all depends on whether the new home market bounces back from this low, or flatlines.)

Since housing is a pre-eminent leading indicator, the ongoing steep decline mortgage applications is not good at all. For the icing on the cake, Congress told the states and the jobless to go somewhere and die -- the last of 5 indicators of a possible double-dip coming in negative. I agree with Bonddad that this is one of the stupidest things the Congress has ever done.

In other news, the final estimate of 1st quarter GDP was revised lower, from 3.0% to 2.7%. Durable goods orders also fell -1.1% (well within the range of noise in this series), while core capital goods rose by 2.1%, showing that manufacturing is still the engine of the growth we do have. Consumers reported more confidence than at any point since January 2008 in the University of Michigan survey.

Edmund's prelimary estimate of June 2010 new vehicle sales is for a 16.6% increase from lasst year but a 9.5% decrease from May, at 11.2 million vs. 11.6 last month. Jessica Caldwell, the spokesperson for Edmunds.com blamed the decline on March's incentives! I'm a little skeptical of that, given the good performance of May in particular.


Turning to the other weekly indicators:

The ICSC reported same store sales for the week ending June 19 were up 2.5% YoY but down -0.5% WoW as the summer doldrums set in. This series has been up between 2.5% to 3.0% YoY for the last month. Meanwhile, Shoppertrak reported YoY sales increased 4.6% and also up 11.0% WoW. Whether these generally good numbers get translated into an improved Census Bureau Retail Sales reading for the month of June remains to be seen.

Gas increased for the fist time since the end of April, up $.04 to $2.74. The 4 week average of usage is very slightly ahead of last year.The price of a barrel of Oil remained at about $76/barrel as of Friday morning, up less than 10% from a year ago. It remains disconcerting that, despite the Euro remaining near its multiyear lows, Oil has nevertheless made up about 50% of its decline from nearly $90/barrel.

The BLS reported 457,000 new jobless claims this week. I continue to suspect that the continuing elevated level of layoffs consists of construction jobs post expiration of the housing credit, and state and municipal workers. Laid off Census workers may also now be contributing to this total.

Railfax showed an improvement in cyclical and intermodal loads this week, mainainting the advance compared with last year.

Weekly M1 and M2 were both down to 4 week lows. M1 is still up about 3% YoY in real terms, and "real" M2 most likely remains ever so slightly positive.

Finally, let's turn to the good news. First, the American Staffing Association reported that for the week of June 7–13, 2010, temporary and contract employment increased 1.96%, pushing the index up one point to a value of 90. This leading employment index continues to point to good news on that front.

Secondly, the Daily Treasury Statement continues to show strong gains vs. last year, 17 days into June. For the month, this year we have $115.2B paid in withholding taxes compared with $106.3B last year, a gain of $8.9B, or 8.5%. For the last 20 reporting days, withholding taxes for 2010 are $125.4B vs. $118.2B a year ago, a gain of 6.5%. Since this very strong showing in payment of withholding taxes coincides with over 200,000 layoffs of census workers (only about 2/10 of 1% of the workforce), it will be very interesting to say the least how June nonfarm payrolls plays out. A strong upside surprise certainly looks possible.

In summary, we have very bad news in a big leading indicator, but good news in the most important coincident indicator of jobs.

Have a nice weekend!

Let the Double Dip Begin and The Costs of Austerity

From the WSJ:

Spooked by concern about deficits, the Senate shelved a spending bill that included an extension of unemployment benefits, suddenly cutting off a federal cash spigot opened by President Barack Obama when he took office 18 months ago.

The collapse of the wide-ranging legislation means that a total of 1.3 million unemployed Americans will have lost their assistance by the end of this week. It will also leave a number of states with large budget holes they had expected to fill with federal cash to help with Medicaid costs.

This is perhaps one of the dumbest, most short-sighted things I have ever seen Congress do.

So -- what will this lead to? From the Financial Times:


Much like Spain, Ireland and the UK, the Baltic states were badly hit by the bursting of a credit bubble in 2008 that sent their economies into freefall and their budget deficits soaring.

While others cushioned the impact with stimulus spending, the Baltic trio plunged straight into austerity. As a result, they suffered the deepest recessions in the European Union last year, with Latvia’s economy shrinking by 18 per cent.

The region has since stabilised but, for many ordinary people it still feels like a depression. Wages have plummeted while unemployment has rocketed, with more than a fifth of the Latvian labour force out of work.

Again, let's look at the GDP equation, shall we?

C+I+(x-i)+G= GDP

C=Consumer spending

I=Investment

x-i= net exports

G=government spending

In other words, government spending is part of he equation, and always has been part of the equation.


Business Investment Picking Up


From the WSJ:

Companies are stepping up spending on equipment as the recovery that first took hold in manufacturing broadens to other areas of the economy.

.....

A Commerce Department report Thursday showed that orders for durable goods—items expected to last at least three years—fell 1.1% in May from April, a drop that was driven by a decline in often-choppy aircraft orders. But a key measure that economists watch to gauge capital-spending plans—nondefense capital-equipment orders excluding aircraft—rose 2.1% and was 18.4% above its year-earlier level.

.....


This has been an untalked about part of the recovery -- how inventory restocking and foreign demand is helping US manufacturing to grow which in turn leads to more investment.

However, here is the basic chain of events:


The ISM manufacturing index is at strong levels. As a result,


durable goods orders have turned around. In addition, the increase productivity


Firms have increased their investment in equipment and software.

In addition, this is not just a story about manufacturing:


increased non-manufacturing orders are helping as well.

Yesterday's Market


For the entire week, the market has been in a clear downtrend (a). When it has moved though key technical support (b, c and d) it has broken support and continued to move lower.


On the daily chart, first note that prices are gravitating around the 200 day EMA (in box f) and have been for the last month. This means that bulls and bears are evenly matched. Prices have tried to rally from this level but found resistance at the 50 day EMA (a). Note the MACD is about to give a sell signal (b) as well. While the A/D line has essentially been moving around a fixed number and therefore really hasn't moved in a big way in either direction for the last two months (c) it has recently moved lower from a slight peak (e).


After breaking key support (a), the dollar has since stabilized right about support levels (b).


For almost two weeks, the dollar has been trading in a pretty narrow range (a).


From a technical perspective, the gold chart has two problems. First, it has made three attempts to cross the 122-123 area and failed (a). In addition we have declining volume (b) for the last part of the rally, indicating weaker participation.


Looking at other indicators, the EMA picture is still very bullish (a), but momentum has decreased (b). The A/D line (c) shows that participation has been about even, but the CMF is decreasing (d).


And the Treasury market is still in an upward trend.

Share

Twitter Delicious Facebook Digg Stumbleupon Favorites More